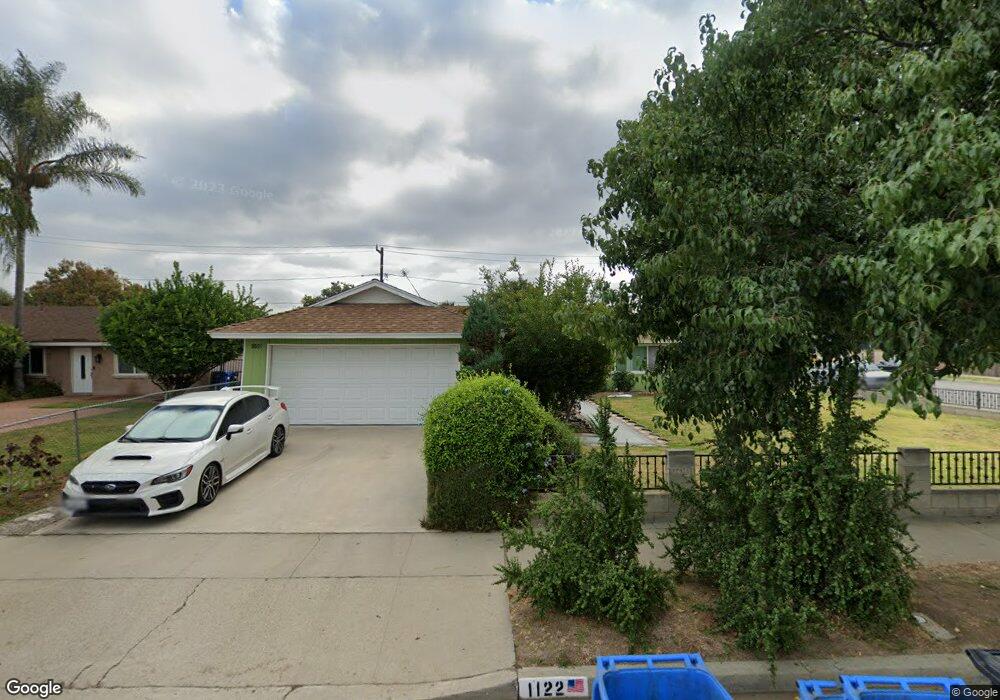
1122 Whitcomb Ave Simi Valley, CA 93065
Central Simi Valley NeighborhoodEstimated Value: $736,675 - $770,000
4
Beds
2
Baths
1,338
Sq Ft
$560/Sq Ft
Est. Value
About This Home
This home is located at 1122 Whitcomb Ave, Simi Valley, CA 93065 and is currently estimated at $749,919, approximately $560 per square foot. 1122 Whitcomb Ave is a home located in Ventura County with nearby schools including Crestview Elementary School, Hillside Middle School, and Royal High School.
Ownership History
Date
Name
Owned For
Owner Type
Purchase Details
Closed on
Aug 29, 2023
Sold by
Yousufi Timor and Yousufi Shaista
Bought by
Timor And Shaista Yousufi Family Trust and Yousufi
Current Estimated Value
Purchase Details
Closed on
Oct 11, 2000
Sold by
Eric Luong and Eric Teresita M
Bought by
Yousufi Timor and Yousufi Shaista
Home Financials for this Owner
Home Financials are based on the most recent Mortgage that was taken out on this home.
Original Mortgage
$179,200
Interest Rate
7.82%
Purchase Details
Closed on
Jun 7, 1994
Sold by
Gellinck Gregory L and Gellinck Cathaleen M
Bought by
Luong Eric and Luong Teresita M
Home Financials for this Owner
Home Financials are based on the most recent Mortgage that was taken out on this home.
Original Mortgage
$153,000
Interest Rate
8.53%
Create a Home Valuation Report for This Property
The Home Valuation Report is an in-depth analysis detailing your home's value as well as a comparison with similar homes in the area
Home Values in the Area
Average Home Value in this Area
Purchase History
| Date | Buyer | Sale Price | Title Company |
|---|---|---|---|
| Timor And Shaista Yousufi Family Trust | -- | None Listed On Document | |
| Yousufi Timor | $224,000 | American Title Co | |
| Luong Eric | $170,000 | First American Title Ins Co |
Source: Public Records
Mortgage History
| Date | Status | Borrower | Loan Amount |
|---|---|---|---|
| Previous Owner | Yousufi Timor | $179,200 | |
| Previous Owner | Luong Eric | $153,000 |
Source: Public Records
Tax History
| Year | Tax Paid | Tax Assessment Tax Assessment Total Assessment is a certain percentage of the fair market value that is determined by local assessors to be the total taxable value of land and additions on the property. | Land | Improvement |
|---|---|---|---|---|
| 2025 | $4,346 | $337,498 | $134,996 | $202,502 |
| 2024 | $4,346 | $330,881 | $132,349 | $198,532 |
| 2023 | $4,084 | $324,394 | $129,754 | $194,640 |
| 2022 | $4,052 | $318,034 | $127,210 | $190,824 |
| 2021 | $4,009 | $311,799 | $124,716 | $187,083 |
| 2020 | $3,916 | $308,603 | $123,438 | $185,165 |
| 2019 | $3,735 | $302,553 | $121,018 | $181,535 |
| 2018 | $3,694 | $296,622 | $118,646 | $177,976 |
| 2017 | $3,605 | $290,807 | $116,320 | $174,487 |
| 2016 | $3,439 | $285,106 | $114,040 | $171,066 |
| 2015 | $3,359 | $280,826 | $112,328 | $168,498 |
| 2014 | $3,303 | $275,328 | $110,129 | $165,199 |
Source: Public Records
Map
Nearby Homes
- 2136 Rosecrans St
- 1091 Vallejo Ave
- 2490 Invar Ct
- 1387 Cherry Ave
- 2025 Royal Ave
- 2407 Elizondo Ave
- 969 Roldan Ave
- 1995 Covington Ave
- 2267 Morley St
- 2044 Covington Ave
- 1917 Fitzgerald Rd
- 2165 Malcolm St
- 2095 Morley St
- 2098 Covington Ave
- 1558 Ysrella Ave
- 2339 Rudolph Dr
- 2643 Dusan St
- 1290 Lawrence Cir
- 2783 Fallon Cir
- 1763 Kearney Ave
- 1136 Whitcomb Ave
- 1123 Brandon Ave
- 1137 Brandon Ave
- 1094 Whitcomb Ave
- 1146 Whitcomb Ave
- 2295 Torrance St
- 1147 Brandon Ave
- 2296 Cutler St
- 1084 Whitcomb Ave
- 2294 Torrance St
- 1164 Whitcomb Ave
- 2283 Torrance St
- 1165 Brandon Ave
- 1085 Brandon Ave
- 2284 Cutler St
- 2339 Torrance St
- 1076 Whitcomb Ave
- 2282 Torrance St
- 1179 Brandon Ave
- 2275 Torrance St
Your Personal Tour Guide
Ask me questions while you tour the home.