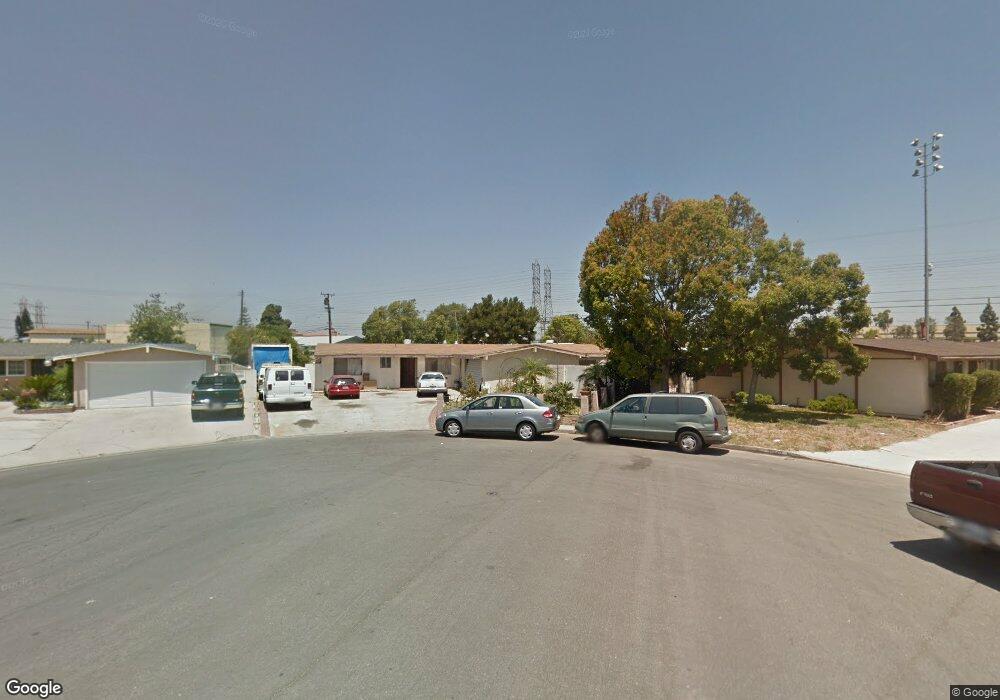
11225 Ale Ln Stanton, CA 90680
Estimated Value: $945,000 - $1,216,322
6
Beds
4
Baths
2,543
Sq Ft
$427/Sq Ft
Est. Value
About This Home
This home is located at 11225 Ale Ln, Stanton, CA 90680 and is currently estimated at $1,085,581, approximately $426 per square foot. 11225 Ale Ln is a home located in Orange County with nearby schools including Bryant Elementary School, Alamitos Intermediate School, and Rancho Alamitos High School.
Ownership History
Date
Name
Owned For
Owner Type
Purchase Details
Closed on
Aug 25, 1995
Sold by
Tapia Maria Luisa
Bought by
Tapia Manuel M
Current Estimated Value
Home Financials for this Owner
Home Financials are based on the most recent Mortgage that was taken out on this home.
Original Mortgage
$175,750
Interest Rate
7.5%
Purchase Details
Closed on
Aug 17, 1995
Sold by
Tapia Adelina
Bought by
Tapia Solano Jose Amadeo
Home Financials for this Owner
Home Financials are based on the most recent Mortgage that was taken out on this home.
Original Mortgage
$175,750
Interest Rate
7.5%
Purchase Details
Closed on
Aug 1, 1995
Sold by
Holland Roger W and Holland Shirley M
Bought by
Tapia Solano Jose Amadeo and Tapia Manuel M
Home Financials for this Owner
Home Financials are based on the most recent Mortgage that was taken out on this home.
Original Mortgage
$175,750
Interest Rate
7.5%
Create a Home Valuation Report for This Property
The Home Valuation Report is an in-depth analysis detailing your home's value as well as a comparison with similar homes in the area
Home Values in the Area
Average Home Value in this Area
Purchase History
| Date | Buyer | Sale Price | Title Company |
|---|---|---|---|
| Tapia Manuel M | -- | Benefit Land Title Company | |
| Tapia Solano Jose Amadeo | -- | -- | |
| Tapia Solano Jose Amadeo | $185,000 | Benefit Land Title Company |
Source: Public Records
Mortgage History
| Date | Status | Borrower | Loan Amount |
|---|---|---|---|
| Closed | Tapia Solano Jose Amadeo | $175,750 |
Source: Public Records
Tax History
| Year | Tax Paid | Tax Assessment Tax Assessment Total Assessment is a certain percentage of the fair market value that is determined by local assessors to be the total taxable value of land and additions on the property. | Land | Improvement |
|---|---|---|---|---|
| 2025 | $3,700 | $307,320 | $180,613 | $126,707 |
| 2024 | $3,700 | $301,295 | $177,072 | $124,223 |
| 2023 | $3,629 | $295,388 | $173,600 | $121,788 |
| 2022 | $3,573 | $289,597 | $170,197 | $119,400 |
| 2021 | $3,539 | $283,919 | $166,860 | $117,059 |
| 2020 | $3,496 | $281,008 | $165,149 | $115,859 |
| 2019 | $3,411 | $275,499 | $161,911 | $113,588 |
| 2018 | $3,355 | $270,098 | $158,737 | $111,361 |
| 2017 | $3,307 | $264,802 | $155,624 | $109,178 |
| 2016 | $3,170 | $259,610 | $152,572 | $107,038 |
| 2015 | $3,130 | $255,711 | $150,280 | $105,431 |
| 2014 | $3,025 | $250,702 | $147,336 | $103,366 |
Source: Public Records
Map
Nearby Homes
- 18 Redwood Ct Unit 18
- 15 Redwood Ct Unit 15
- 7761 Davmor Ave
- 11353 Antonio Unit 13
- 8028 Monaco
- 11250 Beach Blvd Unit 100
- 11250 Beach Blvd Unit 83
- 7961 Orangewood Ave
- 11219 Hood Way
- 10550 Western Ave Unit 3
- 10550 Western Ave Unit 86
- 10550 Western Ave Unit 33
- 10550 Western Ave
- 10550 Western Ave Unit 128
- 10550 Western Ave Unit 29
- 7336 Ewell Way
- 7271 Katella Ave Unit 101
- 7271 Katella Ave Unit 99
- 10891 Scottsbluff Dr
- 10542 Rose St
- 55 Bigsby Dr
- 68 Bigsby Dr
- 0 - Unit CRPW24125354
- 11231 Ale Ln
- 11226 Ale Ln
- 11222 Mario Ln
- 11212 Mario Ln
- 11241 Ale Ln
- 11232 Mario Ln
- 11232 Ale Ln
- 11242 Mario Ln
- 11242 Ale Ln
- 11205 Mario Ln
- 7861 Ruthann Ave
- 7812 Ruthann Ave
- 7822 Ruthann Ave
- 7802 Ruthann Ave
- 11221 Mario Ln
- 7832 Ruthann Ave
- 11231 Mario Ln
Your Personal Tour Guide
Ask me questions while you tour the home.