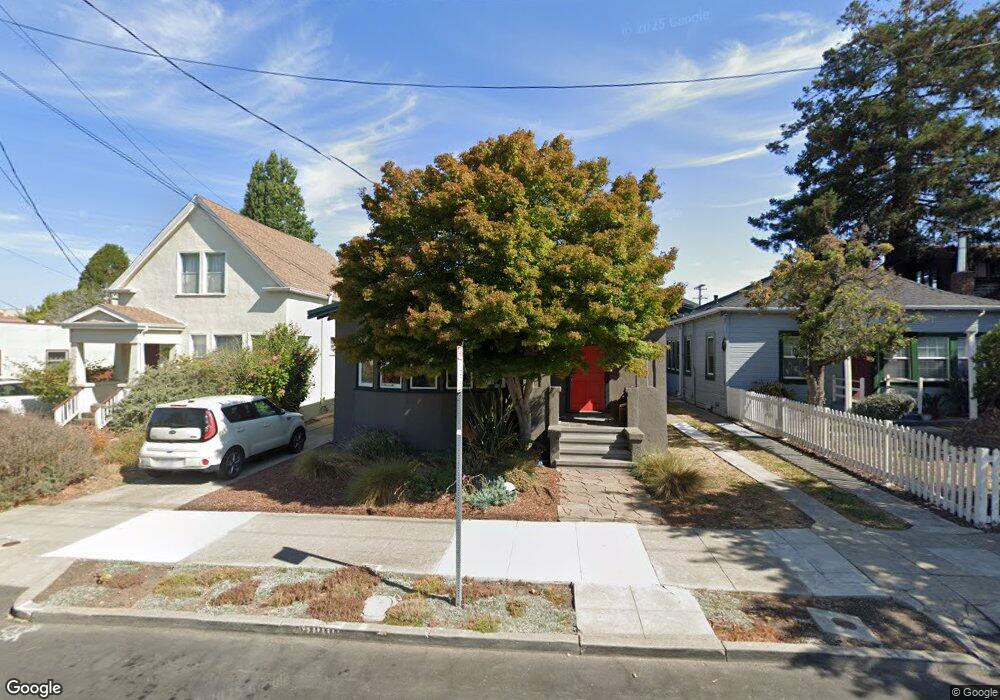
1123 Blake St Berkeley, CA 94702
West Berkeley NeighborhoodEstimated Value: $1,131,000 - $1,421,000
2
Beds
2
Baths
1,224
Sq Ft
$1,042/Sq Ft
Est. Value
About This Home
This home is located at 1123 Blake St, Berkeley, CA 94702 and is currently estimated at $1,275,412, approximately $1,042 per square foot. 1123 Blake St is a home located in Alameda County with nearby schools including Oxford Elementary School, Washington Elementary School, and Malcolm X Elementary School.
Ownership History
Date
Name
Owned For
Owner Type
Purchase Details
Closed on
Jan 24, 2015
Sold by
Deng Yih Charng and Deng Sandra K
Bought by
The Yih Charng & Sandra Deng Family Trus
Current Estimated Value
Purchase Details
Closed on
Nov 15, 2013
Sold by
Ebi Group Llc
Bought by
Deng Yih Charng and Deng Sandra K
Home Financials for this Owner
Home Financials are based on the most recent Mortgage that was taken out on this home.
Original Mortgage
$530,000
Outstanding Balance
$394,462
Interest Rate
4.18%
Mortgage Type
New Conventional
Estimated Equity
$880,950
Purchase Details
Closed on
Feb 19, 2013
Sold by
Nelson Andrea and 2008 Nelson Trust
Bought by
Ebi Group Llc
Home Financials for this Owner
Home Financials are based on the most recent Mortgage that was taken out on this home.
Original Mortgage
$214,000
Interest Rate
3.36%
Mortgage Type
Purchase Money Mortgage
Purchase Details
Closed on
Jun 19, 2008
Sold by
Nelson Andrea
Bought by
Nelson Andrea and 2008 Nelson Trust
Purchase Details
Closed on
Sep 6, 2003
Sold by
Nelson Iris A
Bought by
Nelson Andrea M
Home Financials for this Owner
Home Financials are based on the most recent Mortgage that was taken out on this home.
Original Mortgage
$340,800
Interest Rate
6%
Mortgage Type
Purchase Money Mortgage
Purchase Details
Closed on
Nov 9, 1994
Sold by
Herrold W E and Herrold Jonell
Bought by
Nelson Iris A
Home Financials for this Owner
Home Financials are based on the most recent Mortgage that was taken out on this home.
Original Mortgage
$92,686
Interest Rate
9.23%
Mortgage Type
Seller Take Back
Purchase Details
Closed on
Apr 11, 1994
Sold by
Peelle Financial Corp
Bought by
Herrold W E and Herrold Jonell
Create a Home Valuation Report for This Property
The Home Valuation Report is an in-depth analysis detailing your home's value as well as a comparison with similar homes in the area
Home Values in the Area
Average Home Value in this Area
Purchase History
| Date | Buyer | Sale Price | Title Company |
|---|---|---|---|
| The Yih Charng & Sandra Deng Family Trus | -- | None Available | |
| Deng Yih Charng | $680,000 | First American Title Company | |
| Ebi Group Llc | $297,000 | Old Republic Title Company | |
| Nelson Andrea | -- | None Available | |
| Nelson Andrea M | $426,000 | Ticor Title Company Of Ca | |
| Nelson Iris A | $100,000 | Old Republic Title Company | |
| Herrold W E | $70,000 | Fidelity National Title Ins |
Source: Public Records
Mortgage History
| Date | Status | Borrower | Loan Amount |
|---|---|---|---|
| Open | Deng Yih Charng | $530,000 | |
| Previous Owner | Ebi Group Llc | $214,000 | |
| Previous Owner | Nelson Andrea M | $340,800 | |
| Previous Owner | Nelson Iris A | $92,686 |
Source: Public Records
Tax History
| Year | Tax Paid | Tax Assessment Tax Assessment Total Assessment is a certain percentage of the fair market value that is determined by local assessors to be the total taxable value of land and additions on the property. | Land | Improvement |
|---|---|---|---|---|
| 2025 | $13,489 | $826,550 | $250,065 | $583,485 |
| 2024 | $13,489 | $810,210 | $245,163 | $572,047 |
| 2023 | $13,146 | $801,188 | $240,356 | $560,832 |
| 2022 | $12,843 | $778,481 | $235,644 | $549,837 |
| 2021 | $12,868 | $763,085 | $231,025 | $539,060 |
| 2020 | $12,205 | $762,191 | $228,657 | $533,534 |
| 2019 | $11,744 | $747,251 | $224,175 | $523,076 |
| 2018 | $11,532 | $732,604 | $219,781 | $512,823 |
| 2017 | $11,126 | $718,242 | $215,472 | $502,770 |
| 2016 | $10,767 | $704,160 | $211,248 | $492,912 |
| 2015 | $10,615 | $693,585 | $208,075 | $485,510 |
| 2014 | $10,486 | $680,000 | $204,000 | $476,000 |
Source: Public Records
Map
Nearby Homes
- 1142 Dwight Way
- 1118 Dwight Way
- 1092 Dwight Way
- 2324 Browning St
- 1039 Channing Way
- 2327 10th St Unit 4
- 2231 Byron St
- 2747 San Pablo Ave Unit 507
- 2751 Wallace St
- 1034 Grayson St
- 2241 Ninth St
- 1010 Grayson St
- 931 Bancroft Way
- 2144 Curtis St
- 1515 Derby St
- 1450 Ward St
- 2750 Sacramento St
- 2758 Sacramento St
- 2238 7th St
- 2774 Sacramento St
- 1125 Blake St
- 1121 Blake St
- 1127 Blake St
- 1117 Blake St Unit 1117 Blake Street
- 1117 Blake St
- 1129 Blake St
- 1130 Dwight Way
- 1132 Dwight Way
- 1113 Blake St
- 1140 Dwight Way
- 1116 Dwight Way
- 2516 Mathews St
- 2512 Mathews St
- 1141 Blake St
- 1126 Blake St
- 1122 Blake St
- 1128 Blake St
- 1114 Dwight Way
- 1111 Blake St
- 1200 Dwight Way
Your Personal Tour Guide
Ask me questions while you tour the home.