1123 E Sycamore Ave Orange, CA 92866
Estimated Value: $1,250,000 - $1,490,000
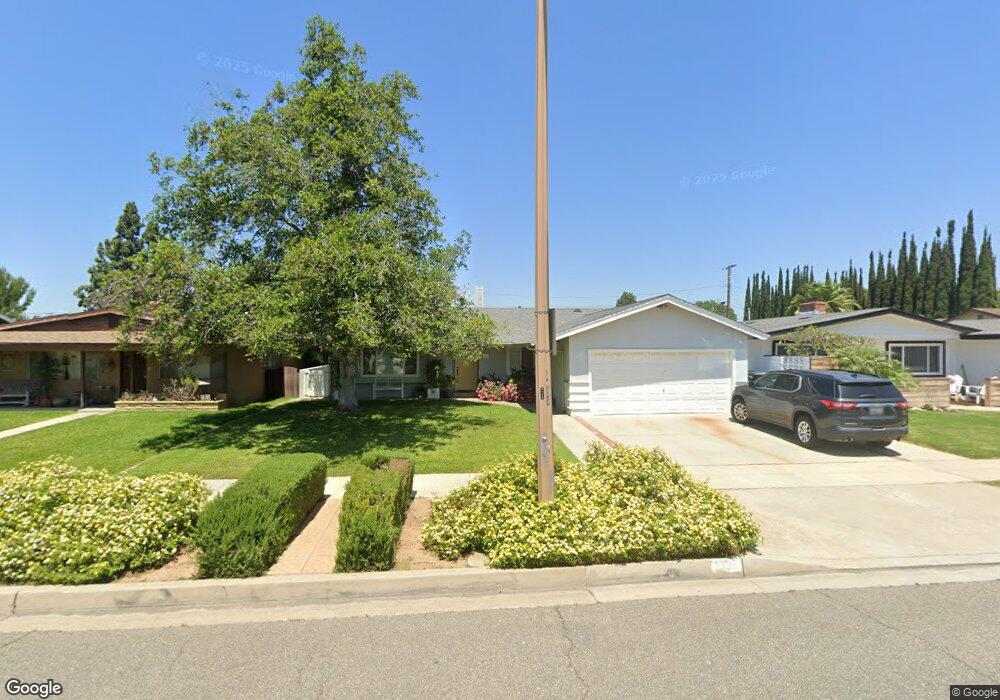
About This Home
This home is located at 1123 E Sycamore Ave, Orange, CA 92866 and is currently estimated at $1,356,095, approximately $683 per square foot. 1123 E Sycamore Ave is a home located in Orange County with nearby schools including Cambridge Elementary School, Yorba Middle School, and Orange High School.
Ownership History
We collect this data history from publicly available records. To have your information removed, we recommend requesting removal directly through your county’s website.
Purchase Details
Purchase Details
Purchase Details
Purchase Details
Home Financials for this Owner
Home Financials are based on the most recent Mortgage that was taken out on this home.Home Values in the Area
Average Home Value in this Area
Purchase History
We collect this data history from publicly available records. To have your information removed, we recommend requesting removal directly through your county’s website.
| Date | Buyer | Sale Price | Title Company |
|---|---|---|---|
| -- | None Available | ||
| -- | Old Republic Title Company | ||
| -- | -- | ||
| $182,500 | Old Republic Title Company |
Mortgage History
We collect this data history from publicly available records. To have your information removed, we recommend requesting removal directly through your county’s website.
| Date | Status | Borrower | Loan Amount |
|---|---|---|---|
| Closed | $173,350 |
Tax History
We collect this data history from publicly available records. To have your information removed, we recommend requesting removal directly through your county’s website.
| Year | Tax Paid | Tax Assessment Tax Assessment Total Assessment is a certain percentage of the fair market value that is determined by local assessors to be the total taxable value of land and additions on the property. | Land | Improvement |
|---|---|---|---|---|
| 2025 | $3,461 | $303,168 | $174,490 | $128,678 |
| 2024 | $3,461 | $297,224 | $171,069 | $126,155 |
| 2023 | $3,380 | $291,397 | $167,715 | $123,682 |
| 2022 | $3,311 | $285,684 | $164,427 | $121,257 |
| 2021 | $3,221 | $280,083 | $161,203 | $118,880 |
| 2020 | $3,190 | $277,212 | $159,550 | $117,662 |
| 2019 | $3,151 | $271,777 | $156,422 | $115,355 |
| 2018 | $3,102 | $266,449 | $153,355 | $113,094 |
| 2017 | $2,977 | $261,225 | $150,348 | $110,877 |
| 2016 | $2,920 | $256,103 | $147,400 | $108,703 |
| 2015 | $2,876 | $252,257 | $145,186 | $107,071 |
| 2014 | $2,814 | $247,316 | $142,342 | $104,974 |
Map
- 365 N Magnolia St
- 822 E Walnut Ave
- 552 N Cambridge St
- 934 E Rose Ave
- 345 N Harwood St
- 178 N Monterey Rd
- 620 N Cambridge St
- 1030 E Oakmont Ave
- 760 N Pine St
- 155 S Lincoln St
- 1908 E Rose Ave
- 1800 E Mayfair Ave
- 774 N Victoria Dr
- 937 E Palmyra Ave
- 633 N Orange St
- 608 E Collins Ave
- 909 N Cleveland St
- 331 N Olive St
- 918 N Cleveland St
- 1944 E Lomita Ave
- 1133 E Sycamore Ave
- 1117 E Sycamore Ave
- 1143 E Sycamore Ave
- 1122 E Sycamore Ave
- 1138 E Sycamore Ave
- 1209 E Sycamore Ave
- 1148 E Sycamore Ave
- 375 N Maplewood St
- 372 N Magnolia St
- 1134 E Walnut Ave
- 367 N Maplewood St
- 390 N Maplewood St
- 1206 E Walnut Ave
- 382 N Maplewood St
- 387 N Magnolia St
- 1204 E Walnut Ave
- 364 N Magnolia St
- 1231 E Sycamore Ave
- 359 N Maplewood St
- 374 N Maplewood St
Ask me questions while you tour the home.