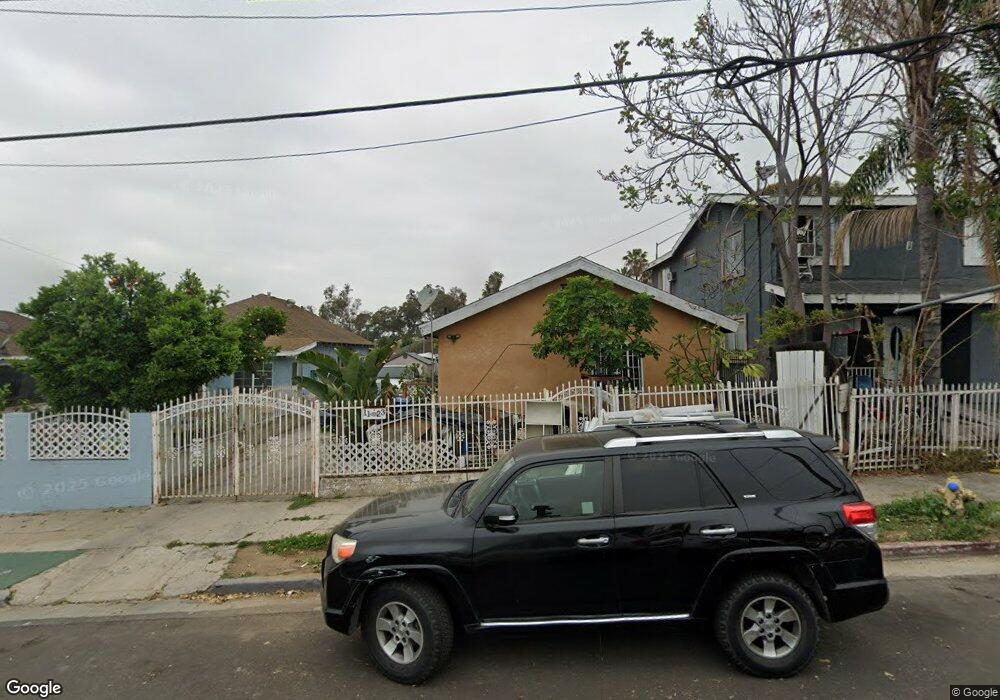
1123 S Mott St Los Angeles, CA 90023
Boyle Heights NeighborhoodEstimated Value: $643,000 - $727,000
2
Beds
3
Baths
1,298
Sq Ft
$522/Sq Ft
Est. Value
About This Home
This home is located at 1123 S Mott St, Los Angeles, CA 90023 and is currently estimated at $677,101, approximately $521 per square foot. 1123 S Mott St is a home located in Los Angeles County with nearby schools including Soto Street Elementary School, Hollenbeck Middle School, and Theodore Roosevelt High School.
Ownership History
Date
Name
Owned For
Owner Type
Purchase Details
Closed on
Oct 18, 1999
Sold by
Allstages Inc
Bought by
Gaytan Rosa Celia
Current Estimated Value
Home Financials for this Owner
Home Financials are based on the most recent Mortgage that was taken out on this home.
Original Mortgage
$118,027
Outstanding Balance
$35,420
Interest Rate
7.75%
Mortgage Type
FHA
Estimated Equity
$641,681
Purchase Details
Closed on
Aug 16, 1999
Sold by
Bankers Trust Company
Bought by
Allstages Inc
Home Financials for this Owner
Home Financials are based on the most recent Mortgage that was taken out on this home.
Original Mortgage
$73,500
Interest Rate
7.56%
Purchase Details
Closed on
Apr 23, 1999
Sold by
Varela Margarita
Bought by
Bankers Trust Company
Create a Home Valuation Report for This Property
The Home Valuation Report is an in-depth analysis detailing your home's value as well as a comparison with similar homes in the area
Home Values in the Area
Average Home Value in this Area
Purchase History
| Date | Buyer | Sale Price | Title Company |
|---|---|---|---|
| Gaytan Rosa Celia | $119,000 | Fidelity National Title Co | |
| Allstages Inc | $50,000 | Fidelity Title | |
| Bankers Trust Company | $60,000 | Benefit Land Title Ins Co |
Source: Public Records
Mortgage History
| Date | Status | Borrower | Loan Amount |
|---|---|---|---|
| Open | Gaytan Rosa Celia | $118,027 | |
| Previous Owner | Allstages Inc | $73,500 |
Source: Public Records
Tax History Compared to Growth
Tax History
| Year | Tax Paid | Tax Assessment Tax Assessment Total Assessment is a certain percentage of the fair market value that is determined by local assessors to be the total taxable value of land and additions on the property. | Land | Improvement |
|---|---|---|---|---|
| 2025 | $3,581 | $280,569 | $117,407 | $163,162 |
| 2024 | $3,581 | $275,068 | $115,105 | $159,963 |
| 2023 | $3,516 | $269,676 | $112,849 | $156,827 |
| 2022 | $3,357 | $264,389 | $110,637 | $153,752 |
| 2021 | $3,312 | $259,206 | $108,468 | $150,738 |
| 2019 | $3,216 | $251,519 | $105,251 | $146,268 |
| 2018 | $3,138 | $246,588 | $103,188 | $143,400 |
| 2016 | $2,991 | $237,015 | $99,182 | $137,833 |
| 2015 | $2,949 | $233,456 | $97,693 | $135,763 |
| 2014 | $2,966 | $228,884 | $95,780 | $133,104 |
Source: Public Records
Map
Nearby Homes
- 1125 Orme Ave
- 976 Marietta St
- 1153 Euclid Ave
- 928 S Breed St
- 716 S Boyle Ave
- 1109 S Dacotah St
- 1126 S Dacotah St
- 3155 E 8th St
- 1143 S Grande Vista Ave
- 657 S Mathews St
- 2851 Guirado St
- 1016 S Grande Vista Ave
- 3247 Garnet St
- 2810 E 6th St
- 624 S Chicago St
- 2038 Hollenbeck Dr
- 2813 E 6th St
- 3320 Opal St
- 2744 Lanfranco St
- 545 S Breed St