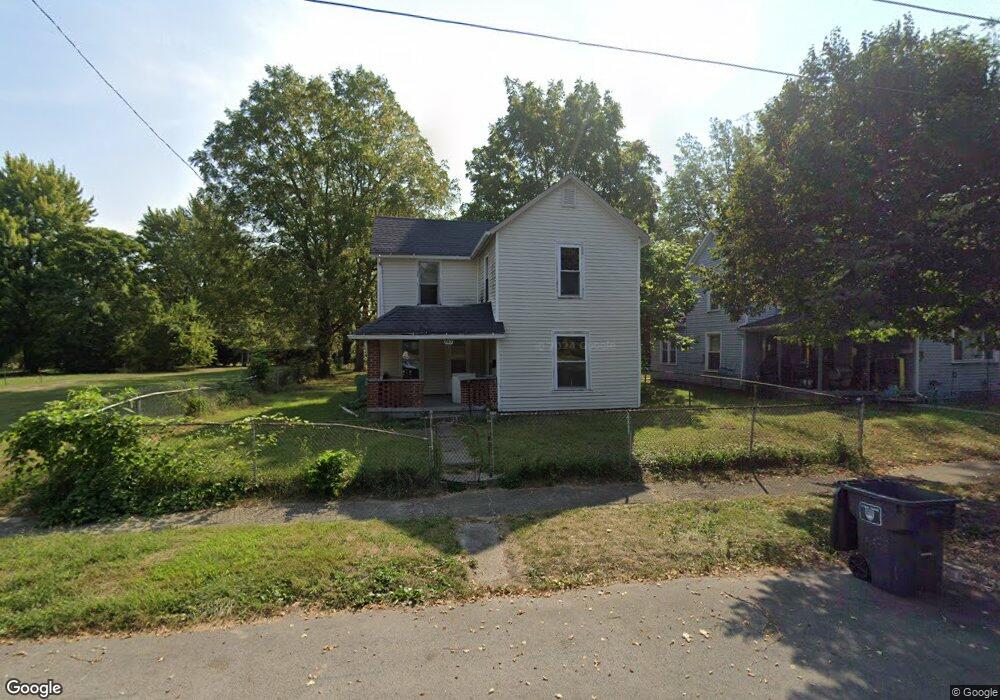
1123 S Union St Lima, OH 45804
Southside Lima NeighborhoodEstimated Value: $45,000 - $81,856
4
Beds
1
Bath
1,492
Sq Ft
$45/Sq Ft
Est. Value
About This Home
This home is located at 1123 S Union St, Lima, OH 45804 and is currently estimated at $67,714, approximately $45 per square foot. 1123 S Union St is a home located in Allen County with nearby schools including Unity Elementary School, Lima North Middle School, and Lima West Middle School.
Ownership History
Date
Name
Owned For
Owner Type
Purchase Details
Closed on
Nov 13, 2019
Sold by
Thompson Robert A and Thompson Robert
Bought by
Lima Alexander Rentals Llc
Current Estimated Value
Purchase Details
Closed on
Jan 28, 2005
Sold by
Mitchell Larry
Bought by
Thompson Robert A
Purchase Details
Closed on
Jan 21, 2005
Sold by
Thompson Robert A
Bought by
Mitchell Larry
Purchase Details
Closed on
Jan 17, 2001
Sold by
Gales Alma L
Bought by
Thompson Robert A
Purchase Details
Closed on
Jan 1, 1990
Bought by
Gales Nathaniel
Create a Home Valuation Report for This Property
The Home Valuation Report is an in-depth analysis detailing your home's value as well as a comparison with similar homes in the area
Home Values in the Area
Average Home Value in this Area
Purchase History
| Date | Buyer | Sale Price | Title Company |
|---|---|---|---|
| Lima Alexander Rentals Llc | -- | None Available | |
| Thompson Robert A | $8,000 | None Available | |
| Mitchell Larry | $14,000 | None Available | |
| Thompson Robert A | $13,500 | -- | |
| Gales Nathaniel | -- | -- |
Source: Public Records
Tax History Compared to Growth
Tax History
| Year | Tax Paid | Tax Assessment Tax Assessment Total Assessment is a certain percentage of the fair market value that is determined by local assessors to be the total taxable value of land and additions on the property. | Land | Improvement |
|---|---|---|---|---|
| 2024 | $422 | $10,120 | $1,190 | $8,930 |
| 2023 | $453 | $9,630 | $1,120 | $8,510 |
| 2022 | $454 | $9,630 | $1,120 | $8,510 |
| 2021 | $530 | $9,630 | $1,120 | $8,510 |
| 2020 | $529 | $9,590 | $1,120 | $8,470 |
| 2019 | $529 | $9,590 | $1,120 | $8,470 |
| 2018 | $524 | $9,590 | $1,120 | $8,470 |
| 2017 | $582 | $9,590 | $1,120 | $8,470 |
| 2016 | $539 | $9,590 | $1,120 | $8,470 |
| 2015 | $547 | $9,590 | $1,120 | $8,470 |
| 2014 | $570 | $10,090 | $1,160 | $8,930 |
| 2013 | $556 | $10,090 | $1,160 | $8,930 |
Source: Public Records
Map
Nearby Homes
- 1147 S Union St
- 1189 S Main St
- 516 Catalpa Ave
- 839 Saint Johns Ave
- 306 E Vine St
- 639 E 4th St
- 640 E 4th St
- 600 Dingledine Ave
- 1008 Fairview Ave
- 865 E 4th St
- 861 E 4th St
- 706 E Kibby St
- 1093 S Sugar St
- 785 Holly St
- 380 S Pine St
- 720 S Metcalf St
- 520 Orena Ave
- 711 W Kibby St
- 1900 Garland Ave
- 11 Unit Multi Family and Sfh
- 1127 S Union St
- 1129 S Union St
- 1111 S Union St
- 1109 S Union St
- 1122 S Union St
- 1112 S Union St
- 1107 S Union St
- 1120 S Central Ave
- 1118 S Union St
- 1114 S Central Ave
- 1130 S Central Ave
- 214 E 2nd St
- 220 E 2nd St
- 200 E 2nd St
- 1126 S Central Ave
- 1110 S Union St
- 1130 S Union St
- 1110 S Central Ave
- 228 E 2nd St
- 1136 S Central Ave