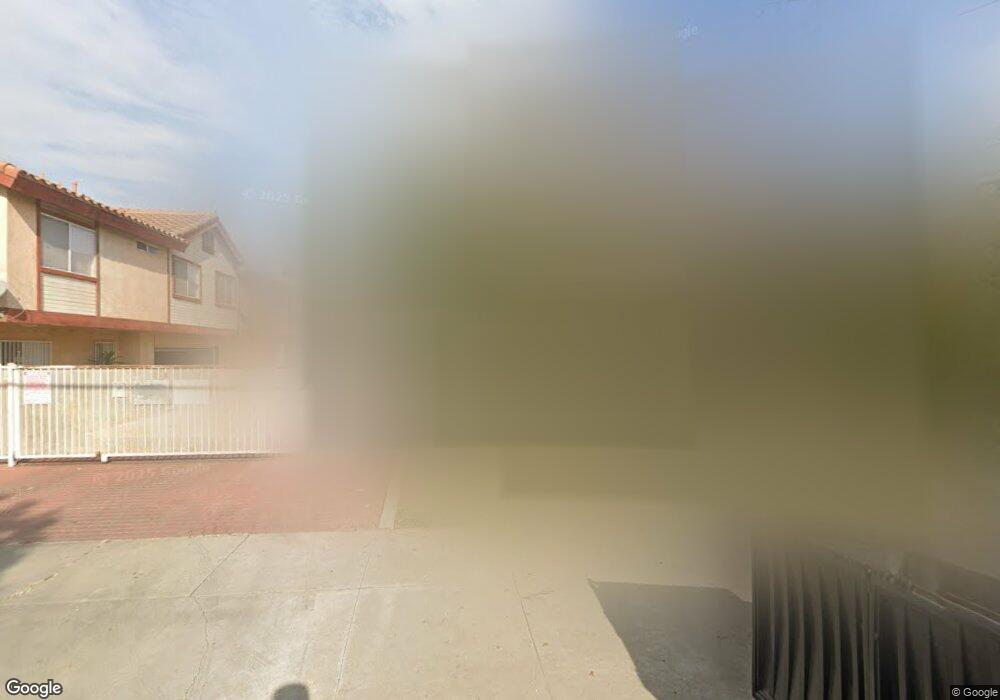
11237 Barnwall St Unit D Norwalk, CA 90650
Estimated Value: $567,297 - $647,000
3
Beds
3
Baths
1,184
Sq Ft
$518/Sq Ft
Est. Value
About This Home
This home is located at 11237 Barnwall St Unit D, Norwalk, CA 90650 and is currently estimated at $613,824, approximately $518 per square foot. 11237 Barnwall St Unit D is a home located in Los Angeles County with nearby schools including Loretta Lampton Elementary School, Los Alisos Middle School, and Norwalk High School.
Ownership History
Date
Name
Owned For
Owner Type
Purchase Details
Closed on
Apr 12, 2000
Sold by
Shin Cho Ja
Bought by
Li Huiyu
Current Estimated Value
Purchase Details
Closed on
Jan 21, 1999
Sold by
Shin Jong Rin
Bought by
Shin Jong Rin and Shin Cho Ja
Home Financials for this Owner
Home Financials are based on the most recent Mortgage that was taken out on this home.
Original Mortgage
$77,000
Interest Rate
6.66%
Purchase Details
Closed on
Jan 12, 1999
Sold by
Liu Frank
Bought by
Shin Jong Rin and Shin Cho Ja
Home Financials for this Owner
Home Financials are based on the most recent Mortgage that was taken out on this home.
Original Mortgage
$77,000
Interest Rate
6.66%
Purchase Details
Closed on
Dec 15, 1994
Sold by
Chiao Mei Development
Bought by
Liu Frank and Chang Grace
Home Financials for this Owner
Home Financials are based on the most recent Mortgage that was taken out on this home.
Original Mortgage
$96,375
Interest Rate
9.15%
Create a Home Valuation Report for This Property
The Home Valuation Report is an in-depth analysis detailing your home's value as well as a comparison with similar homes in the area
Purchase History
| Date | Buyer | Sale Price | Title Company |
|---|---|---|---|
| Li Huiyu | $147,000 | Lawyers Title Company | |
| Shin Jong Rin | -- | Chicago Title Co | |
| Shin Jong Rin | $127,000 | Chicago Title Co | |
| Liu Frank | $128,500 | Fidelity National Title |
Source: Public Records
Mortgage History
| Date | Status | Borrower | Loan Amount |
|---|---|---|---|
| Previous Owner | Shin Jong Rin | $77,000 | |
| Previous Owner | Liu Frank | $96,375 | |
| Closed | Liu Frank | $17,275 |
Source: Public Records
Tax History
| Year | Tax Paid | Tax Assessment Tax Assessment Total Assessment is a certain percentage of the fair market value that is determined by local assessors to be the total taxable value of land and additions on the property. | Land | Improvement |
|---|---|---|---|---|
| 2025 | $3,148 | $225,910 | $88,052 | $137,858 |
| 2024 | $3,148 | $221,481 | $86,326 | $135,155 |
| 2023 | $3,045 | $217,139 | $84,634 | $132,505 |
| 2022 | $2,991 | $212,882 | $82,975 | $129,907 |
| 2021 | $2,946 | $208,709 | $81,349 | $127,360 |
| 2019 | $2,863 | $202,521 | $78,937 | $123,584 |
| 2018 | $2,761 | $198,551 | $77,390 | $121,161 |
| 2016 | $2,639 | $190,843 | $74,386 | $116,457 |
| 2015 | $2,616 | $187,977 | $73,269 | $114,708 |
| 2014 | $2,445 | $184,296 | $71,834 | $112,462 |
Source: Public Records
Map
Nearby Homes
- 15223 Gridley Rd
- 11113 Barnwall St
- 11433 Excelsior Dr Unit E
- 15503 Benfield Ave
- 15019 Roseton Ave
- 15502 Halcourt Ave
- 15503 Halcourt Ave
- 15109 Alburtis Ave
- 15406 Dumont Ave
- 15510 Pioneer Blvd
- 14446 Halcourt Ave
- 15101 Arlee Ave
- 14414 Flallon Ave
- 14742 Pioneer Blvd
- 14508 Dumont Ave
- 11602 Faculty Dr
- 14613 Piuma Ave
- 15105 Domart Ave
- 11909 Lowemont St
- 11864 Hayford St
- 11233 Barnwall St
- 11237 Barnwall St Unit G
- 11237 Barnwall St Unit F
- 11237 Barnwall St Unit E
- 11237 Barnwall St Unit C
- 11237 Barnwall St Unit B
- 11237 Barnwall St Unit A
- 11233 Barnwall St Unit H
- 11233 Barnwall St Unit G
- 11233 Barnwall St Unit F
- 11233 Barnwall St Unit E
- 11233 Barnwall St Unit D
- 11233 Barnwall St Unit C
- 11233 Barnwall St Unit B
- 11233 Barnwall St Unit A
- 11227 Barnwall St
- 11245 Barnwall St
- 11234 Barnwall St
- 11228 Barnwall St
- 11238 Barnwall St
Your Personal Tour Guide
Ask me questions while you tour the home.