1125 Alice St Davis, CA 95616
Central Davis NeighborhoodEstimated Value: $671,000 - $890,000
4
Beds
2
Baths
1,805
Sq Ft
$450/Sq Ft
Est. Value
About This Home
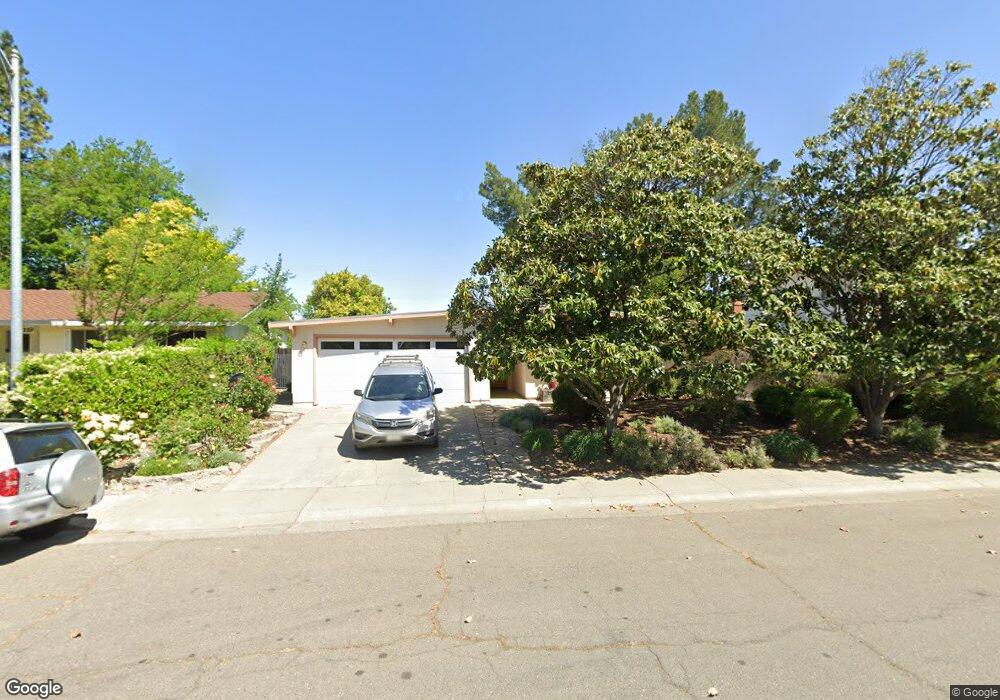
This home is located at 1125 Alice St, Davis, CA 95616 and is currently estimated at $812,070, approximately $449 per square foot. 1125 Alice St is a home located in Yolo County with nearby schools including North Davis Elementary School, Oliver Wendell Holmes Junior High School, and Davis Senior High School.
Ownership History
Date
Name
Owned For
Owner Type
Purchase Details
Closed on
Dec 7, 1999
Sold by
Trowbridge Henry O and Trowbridge Lynda
Bought by
Trowbridge Henry O and Trowbridge Lynda
Current Estimated Value
Purchase Details
Closed on
Jul 24, 1997
Sold by
Renner Wilmer E and Renner Kerstin B
Bought by
Trowbridge Henry O and Trowbridge Lynda
Home Financials for this Owner
Home Financials are based on the most recent Mortgage that was taken out on this home.
Original Mortgage
$154,000
Outstanding Balance
$21,581
Interest Rate
7.25%
Estimated Equity
$790,489
Create a Home Valuation Report for This Property
The Home Valuation Report is an in-depth analysis detailing your home's value as well as a comparison with similar homes in the area
Home Values in the Area
Average Home Value in this Area
Purchase History
| Date | Buyer | Sale Price | Title Company |
|---|---|---|---|
| Trowbridge Henry O | -- | -- | |
| Trowbridge Henry O | $192,500 | North American Title Co |
Source: Public Records
Mortgage History
| Date | Status | Borrower | Loan Amount |
|---|---|---|---|
| Open | Trowbridge Henry O | $154,000 |
Source: Public Records
Tax History
| Year | Tax Paid | Tax Assessment Tax Assessment Total Assessment is a certain percentage of the fair market value that is determined by local assessors to be the total taxable value of land and additions on the property. | Land | Improvement |
|---|---|---|---|---|
| 2025 | $4,725 | $323,446 | $103,775 | $219,671 |
| 2023 | $4,725 | $310,889 | $99,747 | $211,142 |
| 2022 | $4,518 | $304,794 | $97,792 | $207,002 |
| 2021 | $4,401 | $298,819 | $95,875 | $202,944 |
| 2020 | $4,328 | $295,756 | $94,892 | $200,864 |
| 2019 | $4,059 | $289,958 | $93,032 | $196,926 |
| 2018 | $3,792 | $284,273 | $91,208 | $193,065 |
| 2017 | $3,710 | $278,700 | $89,420 | $189,280 |
| 2016 | $3,567 | $273,236 | $87,667 | $185,569 |
| 2015 | $3,451 | $269,133 | $86,351 | $182,782 |
| 2014 | $3,451 | $263,862 | $84,660 | $179,202 |
Source: Public Records
Map
Nearby Homes
- 1416 Drexel Dr
- 615 11th St
- 1224 Spruce Ln
- 739 M St
- 601 J St
- 646 F St
- 1513 Cypress Ln
- 717 D St
- 425 J St
- 1000 Berryessa Ln Unit 211
- 405 7th St
- 1411 Madrone Ln
- 1661 Spring St Unit 411
- 1661 Spring St Unit 424
- 1661 Spring St Unit 444
- 1661 Spring St Unit 341
- 2011 Regis Dr
- 2128 Bueno Dr Unit 18
- 2128 Bueno Dr Unit 5
- 1731 Heirloom St
Your Personal Tour Guide
Ask me questions while you tour the home.