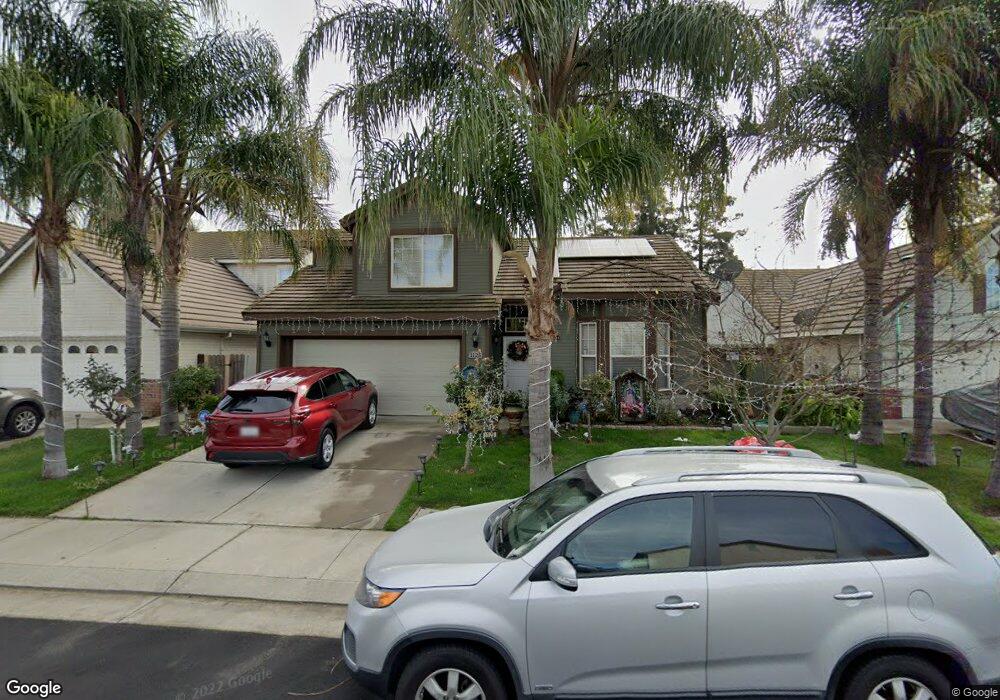
1125 Klemeyer Cir Stockton, CA 95206
Weston Ranch NeighborhoodEstimated Value: $423,000 - $492,000
4
Beds
3
Baths
1,726
Sq Ft
$272/Sq Ft
Est. Value
About This Home
This home is located at 1125 Klemeyer Cir, Stockton, CA 95206 and is currently estimated at $469,460, approximately $271 per square foot. 1125 Klemeyer Cir is a home located in San Joaquin County with nearby schools including Great Valley Elementary School and Weston Ranch High School.
Ownership History
Date
Name
Owned For
Owner Type
Purchase Details
Closed on
Aug 17, 2005
Sold by
Amaya Pedro A
Bought by
Amaya Pedro A and Perez Maria G
Current Estimated Value
Home Financials for this Owner
Home Financials are based on the most recent Mortgage that was taken out on this home.
Original Mortgage
$318,750
Outstanding Balance
$177,952
Interest Rate
6.65%
Mortgage Type
Purchase Money Mortgage
Estimated Equity
$291,508
Purchase Details
Closed on
Aug 26, 2004
Sold by
Perez Maria G
Bought by
Amaya Pedro A
Home Financials for this Owner
Home Financials are based on the most recent Mortgage that was taken out on this home.
Original Mortgage
$268,800
Interest Rate
9.6%
Mortgage Type
New Conventional
Purchase Details
Closed on
Mar 11, 1998
Sold by
Bright Development
Bought by
Amaya Pedro Aldaco and Perez Maria Guadalupe
Home Financials for this Owner
Home Financials are based on the most recent Mortgage that was taken out on this home.
Original Mortgage
$129,772
Interest Rate
6.95%
Mortgage Type
FHA
Create a Home Valuation Report for This Property
The Home Valuation Report is an in-depth analysis detailing your home's value as well as a comparison with similar homes in the area
Home Values in the Area
Average Home Value in this Area
Purchase History
| Date | Buyer | Sale Price | Title Company |
|---|---|---|---|
| Amaya Pedro A | -- | -- | |
| Amaya Pedro A | -- | Fidelity Natl Title Ins Co | |
| Amaya Pedro Aldaco | $132,000 | North American Title Co |
Source: Public Records
Mortgage History
| Date | Status | Borrower | Loan Amount |
|---|---|---|---|
| Open | Amaya Pedro A | $318,750 | |
| Closed | Amaya Pedro A | $268,800 | |
| Previous Owner | Amaya Pedro Aldaco | $129,772 |
Source: Public Records
Tax History Compared to Growth
Tax History
| Year | Tax Paid | Tax Assessment Tax Assessment Total Assessment is a certain percentage of the fair market value that is determined by local assessors to be the total taxable value of land and additions on the property. | Land | Improvement |
|---|---|---|---|---|
| 2025 | $3,176 | $206,903 | $39,188 | $167,715 |
| 2024 | $3,069 | $202,847 | $38,420 | $164,427 |
| 2023 | $2,942 | $198,870 | $37,667 | $161,203 |
| 2022 | $2,872 | $194,972 | $36,929 | $158,043 |
| 2021 | $2,814 | $191,150 | $36,205 | $154,945 |
| 2020 | $2,711 | $189,191 | $35,834 | $153,357 |
| 2019 | $2,666 | $185,482 | $35,132 | $150,350 |
| 2018 | $2,646 | $181,846 | $34,444 | $147,402 |
| 2017 | $2,598 | $178,281 | $33,769 | $144,512 |
| 2016 | $2,497 | $174,786 | $33,107 | $141,679 |
| 2014 | $2,525 | $168,788 | $31,971 | $136,817 |
Source: Public Records
Map
Nearby Homes
- 1131 Klemeyer Cir
- 1141 Klemeyer Cir
- 971 Kate Linde Cir
- 1117 Glenmohr Ct
- 921 Kate Linde Cir
- 1044 Henry Long Blvd
- 3412 Shogoro Ln
- 4116 Vercelli St
- 4303 Giselle Ln
- 4144 Blake Cir
- 703 Villanueva Ct
- 4135 Roma Ln
- 1890 Gordon Verner Cir
- 627 Queensland Cir
- 4154 Kassady Ct
- 3812 Steve Lillie Cir
- 1842 William Moss Blvd
- 4309 Blake Cir
- 1817 Germain Ln
- 761 Sandstone Dr
- 1127 Klemeyer Cir
- 1123 Klemeyer Cir
- 1237 William Moss Blvd
- 1129 Klemeyer Cir
- 1229 William Moss Blvd
- 1245 William Moss Blvd
- 1121 Klemeyer Cir
- 1221 William Moss Blvd
- 1116 Klemeyer Cir
- 1253 William Moss Blvd
- 3885 Marnie Ct
- 1213 William Moss Blvd
- 1261 William Moss Blvd
- 1119 Klemeyer Cir
- 1133 Klemeyer Cir
- 3871 Marnie Ct
- 1114 Klemeyer Cir
- 1117 Klemeyer Cir
- 1207 William Moss Blvd
- 1269 William Moss Blvd