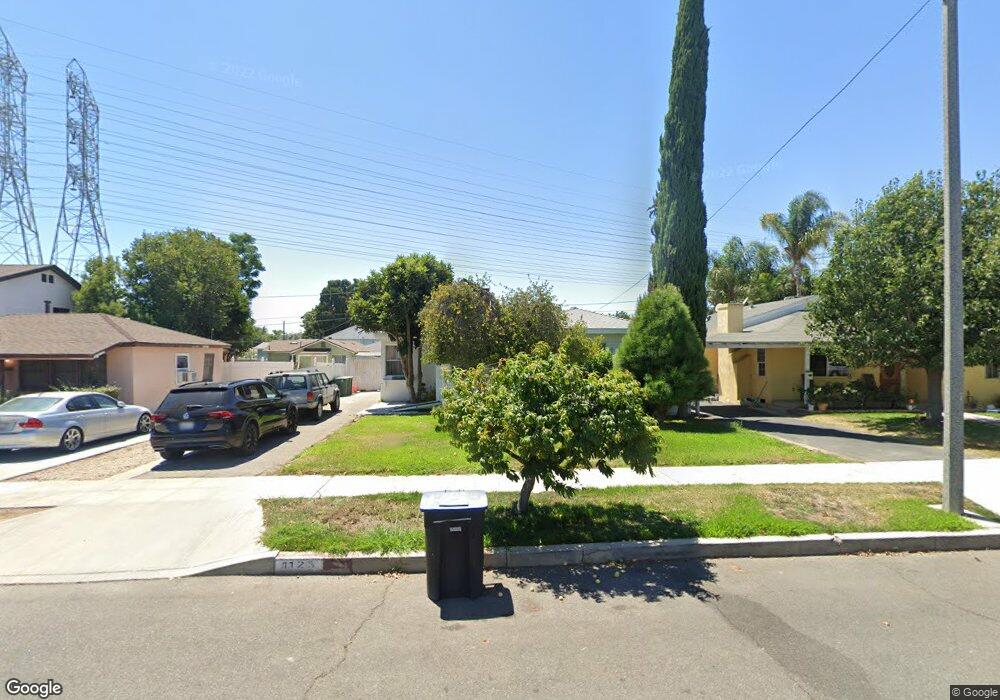
1125 N Maple St Burbank, CA 91505
Magnolia Park NeighborhoodEstimated Value: $943,000 - $1,258,000
2
Beds
2
Baths
1,271
Sq Ft
$852/Sq Ft
Est. Value
About This Home
This home is located at 1125 N Maple St, Burbank, CA 91505 and is currently estimated at $1,082,399, approximately $851 per square foot. 1125 N Maple St is a home located in Los Angeles County with nearby schools including Dolores Huerta Middle School, John Burroughs High School, and Toluca Crossroads School.
Ownership History
Date
Name
Owned For
Owner Type
Purchase Details
Closed on
Aug 30, 2019
Sold by
Drissi Paule
Bought by
Paule Drissi Living Trust and Drissi
Current Estimated Value
Purchase Details
Closed on
Dec 30, 2013
Sold by
Drissi Brahim A
Bought by
Drissi Paule
Purchase Details
Closed on
Sep 4, 1997
Sold by
Meley Helen D
Bought by
Drissi Brahim A and Drissi Paule A
Home Financials for this Owner
Home Financials are based on the most recent Mortgage that was taken out on this home.
Original Mortgage
$125,000
Interest Rate
7.54%
Create a Home Valuation Report for This Property
The Home Valuation Report is an in-depth analysis detailing your home's value as well as a comparison with similar homes in the area
Home Values in the Area
Average Home Value in this Area
Purchase History
| Date | Buyer | Sale Price | Title Company |
|---|---|---|---|
| Paule Drissi Living Trust | -- | None Listed On Document | |
| Drissi Paule | -- | None Available | |
| Drissi Brahim A | $175,000 | Old Republic Title Company |
Source: Public Records
Mortgage History
| Date | Status | Borrower | Loan Amount |
|---|---|---|---|
| Previous Owner | Drissi Brahim A | $125,000 |
Source: Public Records
Tax History
| Year | Tax Paid | Tax Assessment Tax Assessment Total Assessment is a certain percentage of the fair market value that is determined by local assessors to be the total taxable value of land and additions on the property. | Land | Improvement |
|---|---|---|---|---|
| 2025 | $3,184 | $279,403 | $179,301 | $100,102 |
| 2024 | $3,184 | $273,926 | $175,786 | $98,140 |
| 2023 | $3,150 | $268,556 | $172,340 | $96,216 |
| 2022 | $3,010 | $263,291 | $168,961 | $94,330 |
| 2021 | $2,992 | $258,130 | $165,649 | $92,481 |
| 2019 | $2,923 | $250,476 | $160,737 | $89,739 |
| 2018 | $2,762 | $245,566 | $157,586 | $87,980 |
| 2016 | $2,611 | $236,032 | $151,468 | $84,564 |
| 2015 | $2,558 | $232,487 | $149,193 | $83,294 |
| 2014 | $2,558 | $227,934 | $146,271 | $81,663 |
Source: Public Records
Map
Nearby Homes
- 1025 N Screenland Dr
- 1030 N Cordova St
- 1343 N Whitnall Hwy
- 5527 Clybourn Ave
- 1307 N Avon St
- 1415 N Screenland Dr
- 821 N Maple St
- 829 N Valley St
- 1423 N Hollywood Way
- 5430 Auckland Ave
- 1457 N Rose St
- 10443 Magnolia Blvd
- 1511 N Maple St
- 1516 N Pepper St
- 741 N Clybourn Ave
- 1505 N Rose St
- 5326 Cahuenga Blvd
- 5516 Willowcrest Ave
- 5528 Willowcrest Ave
- 5241 Cahuenga Blvd
- 1131 N Maple St
- 1119 N Maple St
- 1122 N Pass Ave
- 1124 N Pass Ave
- 1135 N Maple St
- 1130 N Pass Ave
- 1115 N Maple St
- 1134 N Pass Ave
- 1124 N Maple St
- 1109 N Maple St
- 1130 N Maple St
- 1122 N Maple St
- 1118 N Maple St
- 1136 N Maple St
- 4004 W Chandler Blvd
- 4000 W Chandler Blvd
- 4008 W Chandler Blvd
- 4010 W Chandler Blvd
- 1112 N Maple St
- 1105 N Maple St
Your Personal Tour Guide
Ask me questions while you tour the home.