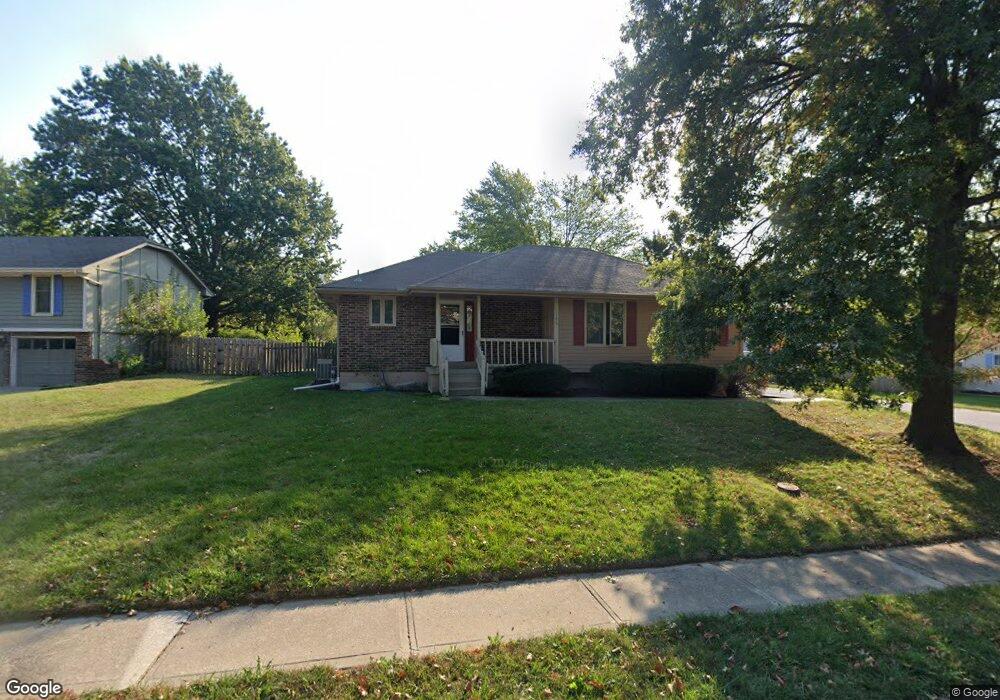
1125 NE Richardson Place Lees Summit, MO 64086
Estimated Value: $280,492 - $307,000
3
Beds
2
Baths
1,200
Sq Ft
$246/Sq Ft
Est. Value
About This Home
This home is located at 1125 NE Richardson Place, Lees Summit, MO 64086 and is currently estimated at $295,373, approximately $246 per square foot. 1125 NE Richardson Place is a home located in Jackson County with nearby schools including Underwood Elementary School, Bernard C. Campbell Middle School, and Lee's Summit North High School.
Ownership History
Date
Name
Owned For
Owner Type
Purchase Details
Closed on
Oct 20, 2005
Sold by
Cohoon Bruce A and Cohoon Vicki L
Bought by
Pardun Michael and Pardun Rita
Current Estimated Value
Home Financials for this Owner
Home Financials are based on the most recent Mortgage that was taken out on this home.
Original Mortgage
$130,500
Outstanding Balance
$69,541
Interest Rate
5.69%
Mortgage Type
Fannie Mae Freddie Mac
Estimated Equity
$225,832
Purchase Details
Closed on
Feb 27, 2001
Sold by
Malcolm Dorothy
Bought by
Bronson Richard T and Bronson Sandra M
Home Financials for this Owner
Home Financials are based on the most recent Mortgage that was taken out on this home.
Original Mortgage
$101,500
Interest Rate
6.85%
Mortgage Type
Purchase Money Mortgage
Purchase Details
Closed on
Oct 17, 1997
Sold by
Mansfield John K and Mansfield Leah M
Bought by
Malcolm Dorothy J
Create a Home Valuation Report for This Property
The Home Valuation Report is an in-depth analysis detailing your home's value as well as a comparison with similar homes in the area
Home Values in the Area
Average Home Value in this Area
Purchase History
| Date | Buyer | Sale Price | Title Company |
|---|---|---|---|
| Pardun Michael | -- | Commonwealth Title | |
| Bronson Richard T | -- | Chicago Title Co | |
| Malcolm Dorothy J | -- | -- |
Source: Public Records
Mortgage History
| Date | Status | Borrower | Loan Amount |
|---|---|---|---|
| Open | Pardun Michael | $130,500 | |
| Previous Owner | Bronson Richard T | $101,500 |
Source: Public Records
Tax History Compared to Growth
Tax History
| Year | Tax Paid | Tax Assessment Tax Assessment Total Assessment is a certain percentage of the fair market value that is determined by local assessors to be the total taxable value of land and additions on the property. | Land | Improvement |
|---|---|---|---|---|
| 2025 | $2,530 | $38,947 | $7,019 | $31,928 |
| 2024 | $2,511 | $35,034 | $5,235 | $29,799 |
| 2023 | $2,511 | $35,035 | $5,368 | $29,667 |
| 2022 | $2,377 | $29,450 | $5,634 | $23,816 |
| 2021 | $2,427 | $29,450 | $5,634 | $23,816 |
| 2020 | $2,333 | $28,034 | $5,634 | $22,400 |
| 2019 | $2,269 | $28,034 | $5,634 | $22,400 |
| 2018 | $2,363 | $27,089 | $3,962 | $23,127 |
| 2017 | $2,327 | $27,089 | $3,962 | $23,127 |
| 2016 | $2,327 | $26,410 | $4,484 | $21,926 |
| 2014 | $2,305 | $25,647 | $4,186 | $21,461 |
Source: Public Records
Map
Nearby Homes
- 1121 NE Ridgeview Dr
- 732 NE Deerbrook St
- 1220 NE Hendrix Dr
- 1345 NE Foxwood Dr
- 807 NE Balboa St
- 809 NE Mulberry St
- 1408 NE Whitestone Dr
- 653 NE Reed Crossing
- 27008 E Olive Dr
- 27104 E Cedar Grove Dr
- 1637 NE Westwind Dr
- 1300 NE Browning Ln
- 800 NE Mulberry St
- 1404 NE Oakwood Dr
- 1424 NE Stonewood Dr
- 705 NE Balboa St
- 717 NE Mulberry St
- 718 NE Mulberry St
- 1425 NE Stonewood Dr
- 801 NE Bryant Dr
- 1129 NE Richardson Place
- 1126 NE Richardson Place
- 1130 NE Richardson Place
- 1119 NE Richardson Place
- 1133 NE Richardson Place
- 1134 NE Richardson Place
- 1138 NE Richardson Place
- 1118 NE Richardson Place
- 1115 NE Richardson Place
- 1130 NE Banner Dr
- 1114 NE Richardson Place
- 1120 NE Banner Dr
- 1111 NE Richardson Place
- 1125 NE Westwind Dr
- 1138 NE Banner Dr
- 1129 NE Westwind Dr
- 1116 NE Banner Dr
- 1110 NE Richardson Place
- 1133 NE Westwind Dr
- 1019 NE Deerbrook Terrace