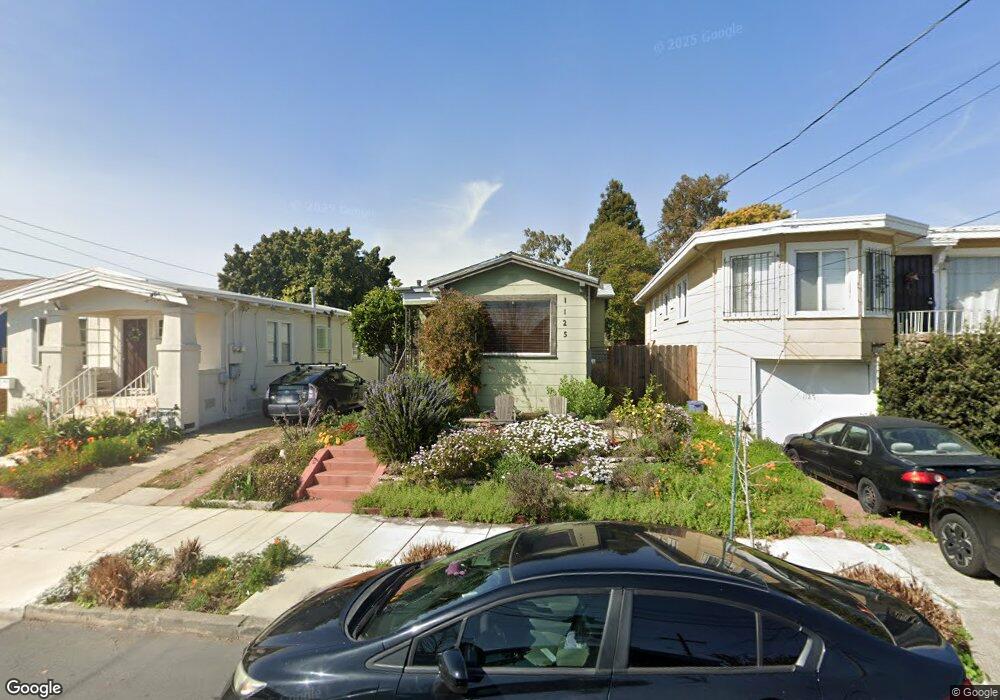
1125 Ward St Berkeley, CA 94702
West Berkeley NeighborhoodEstimated Value: $889,000 - $951,000
2
Beds
1
Bath
815
Sq Ft
$1,123/Sq Ft
Est. Value
About This Home
This home is located at 1125 Ward St, Berkeley, CA 94702 and is currently estimated at $915,616, approximately $1,123 per square foot. 1125 Ward St is a home located in Alameda County with nearby schools including Malcolm X Elementary School, Oxford Elementary School, and Washington Elementary School.
Ownership History
Date
Name
Owned For
Owner Type
Purchase Details
Closed on
Dec 31, 2008
Sold by
Hickman Verna R
Bought by
Robbins Michael Andrew
Current Estimated Value
Home Financials for this Owner
Home Financials are based on the most recent Mortgage that was taken out on this home.
Original Mortgage
$287,960
Outstanding Balance
$189,553
Interest Rate
5.97%
Mortgage Type
Purchase Money Mortgage
Estimated Equity
$726,063
Purchase Details
Closed on
Jun 9, 2008
Sold by
Hickman Verna R and The Evelyn Gray Living Trust
Bought by
Hickman Verna R
Purchase Details
Closed on
Apr 18, 2005
Sold by
Gray Evelyn
Bought by
Gray Evelyn and The Evelyn Gray Revocable Trus
Home Financials for this Owner
Home Financials are based on the most recent Mortgage that was taken out on this home.
Original Mortgage
$469,342
Interest Rate
4.82%
Mortgage Type
Reverse Mortgage Home Equity Conversion Mortgage
Purchase Details
Closed on
Feb 12, 2005
Sold by
Gray Evelyn
Bought by
Gray Evelyn and Evelyn Gray Revocable Trust
Create a Home Valuation Report for This Property
The Home Valuation Report is an in-depth analysis detailing your home's value as well as a comparison with similar homes in the area
Home Values in the Area
Average Home Value in this Area
Purchase History
| Date | Buyer | Sale Price | Title Company |
|---|---|---|---|
| Robbins Michael Andrew | $320,000 | First American Title Company | |
| Hickman Verna R | -- | None Available | |
| Gray Evelyn | -- | North American Title Co | |
| Gray Evelyn | -- | North American Title Co | |
| Gray Evelyn | -- | -- |
Source: Public Records
Mortgage History
| Date | Status | Borrower | Loan Amount |
|---|---|---|---|
| Open | Robbins Michael Andrew | $287,960 | |
| Previous Owner | Gray Evelyn | $469,342 | |
| Closed | Gray Evelyn | $469,342 |
Source: Public Records
Tax History
| Year | Tax Paid | Tax Assessment Tax Assessment Total Assessment is a certain percentage of the fair market value that is determined by local assessors to be the total taxable value of land and additions on the property. | Land | Improvement |
|---|---|---|---|---|
| 2025 | $6,670 | $412,054 | $123,616 | $288,438 |
| 2024 | $6,670 | $403,977 | $121,193 | $282,784 |
| 2023 | $6,527 | $396,057 | $118,817 | $277,240 |
| 2022 | $6,405 | $388,294 | $116,488 | $271,806 |
| 2021 | $6,413 | $380,681 | $114,204 | $266,477 |
| 2020 | $6,070 | $376,780 | $113,034 | $263,746 |
| 2019 | $5,830 | $369,394 | $110,818 | $258,576 |
| 2018 | $5,729 | $362,153 | $108,646 | $253,507 |
| 2017 | $5,505 | $355,051 | $106,515 | $248,536 |
| 2016 | $5,323 | $348,091 | $104,427 | $243,664 |
| 2015 | $5,252 | $342,867 | $102,860 | $240,007 |
| 2014 | $5,215 | $336,153 | $100,846 | $235,307 |
Source: Public Records
Map
Nearby Homes
- 2747 San Pablo Ave Unit 507
- 2751 Wallace St
- 1034 Grayson St
- 1010 Grayson St
- 1118 Dwight Way
- 1142 Dwight Way
- 1092 Dwight Way
- 1237 Ashby Ave
- 1450 Ward St
- 2758 Sacramento St
- 2774 Sacramento St
- 2782 Sacramento St
- 2750 Sacramento St
- 2790 Sacramento St
- 1314 Ashby Ave
- 2922 Stanton St
- 1515 Derby St
- 3032 Mabel St
- 1039 Channing Way
- 1530 Stuart St
Your Personal Tour Guide
Ask me questions while you tour the home.