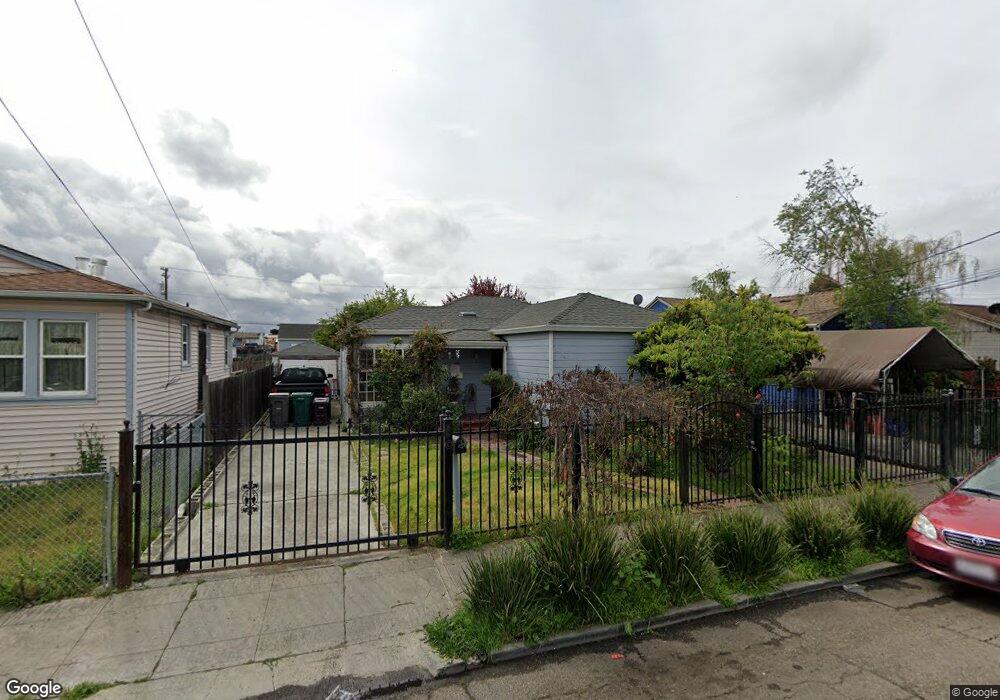
1126 76th Ave Oakland, CA 94621
Fitchburg NeighborhoodEstimated Value: $438,000 - $460,285
2
Beds
1
Bath
895
Sq Ft
$505/Sq Ft
Est. Value
About This Home
This home is located at 1126 76th Ave, Oakland, CA 94621 and is currently estimated at $452,321, approximately $505 per square foot. 1126 76th Ave is a home located in Alameda County with nearby schools including Futures & CUES at Lockwood, Greenleaf TK-8, and Coliseum College Prep Academy.
Ownership History
Date
Name
Owned For
Owner Type
Purchase Details
Closed on
Jan 28, 2002
Sold by
Reed Johnny
Bought by
Delgado Romualdo C and Decamacho Raquel Aguilar
Current Estimated Value
Home Financials for this Owner
Home Financials are based on the most recent Mortgage that was taken out on this home.
Original Mortgage
$170,000
Outstanding Balance
$70,740
Interest Rate
7.15%
Estimated Equity
$381,581
Purchase Details
Closed on
Jan 12, 1994
Sold by
Buril Christine
Bought by
Reed Johnny
Create a Home Valuation Report for This Property
The Home Valuation Report is an in-depth analysis detailing your home's value as well as a comparison with similar homes in the area
Home Values in the Area
Average Home Value in this Area
Purchase History
| Date | Buyer | Sale Price | Title Company |
|---|---|---|---|
| Delgado Romualdo C | $173,500 | Placer Title Company | |
| Reed Johnny | -- | Placer Title Company | |
| Reed Johnny | -- | -- |
Source: Public Records
Mortgage History
| Date | Status | Borrower | Loan Amount |
|---|---|---|---|
| Open | Delgado Romualdo C | $170,000 |
Source: Public Records
Tax History Compared to Growth
Tax History
| Year | Tax Paid | Tax Assessment Tax Assessment Total Assessment is a certain percentage of the fair market value that is determined by local assessors to be the total taxable value of land and additions on the property. | Land | Improvement |
|---|---|---|---|---|
| 2025 | $4,927 | $249,294 | $76,962 | $179,332 |
| 2024 | $4,927 | $244,269 | $75,453 | $175,816 |
| 2023 | $5,082 | $246,343 | $73,974 | $172,369 |
| 2022 | $4,897 | $234,513 | $72,523 | $168,990 |
| 2021 | $4,573 | $229,778 | $71,101 | $165,677 |
| 2020 | $4,521 | $234,351 | $70,373 | $163,978 |
| 2019 | $4,282 | $229,756 | $68,993 | $160,763 |
| 2018 | $4,195 | $225,252 | $67,640 | $157,612 |
| 2017 | $3,573 | $220,836 | $66,314 | $154,522 |
| 2016 | $3,340 | $205,000 | $61,500 | $143,500 |
| 2015 | $3,127 | $165,000 | $49,500 | $115,500 |
| 2014 | $2,973 | $155,000 | $46,500 | $108,500 |
Source: Public Records
Map
Nearby Homes