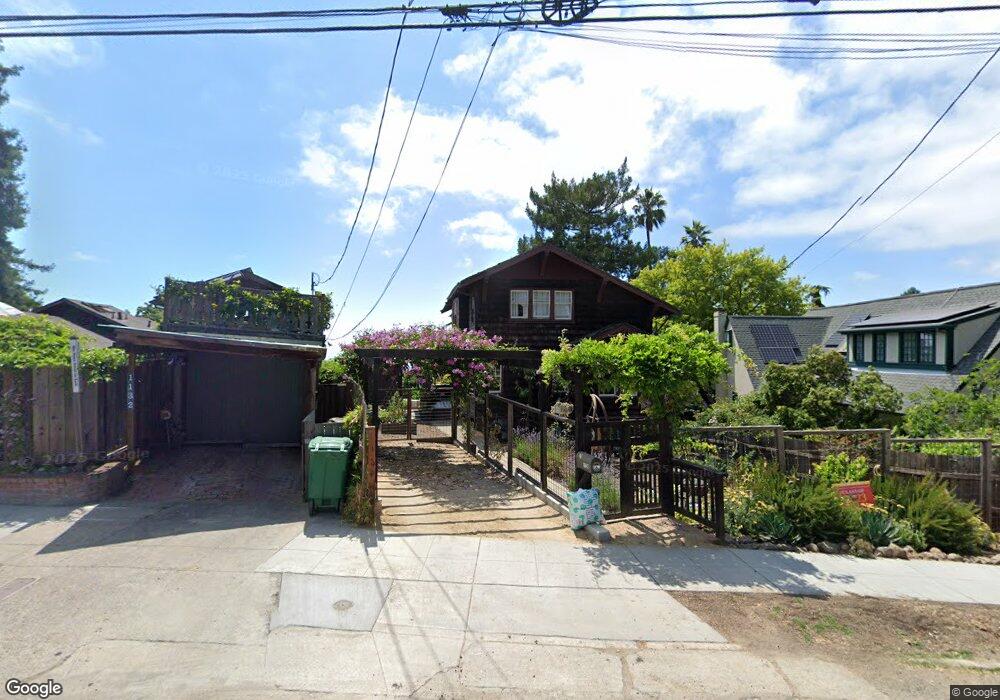
1126 Arch St Berkeley, CA 94708
Berkeley Hills NeighborhoodEstimated Value: $1,592,000 - $1,795,000
4
Beds
2
Baths
1,871
Sq Ft
$922/Sq Ft
Est. Value
About This Home
This home is located at 1126 Arch St, Berkeley, CA 94708 and is currently estimated at $1,725,333, approximately $922 per square foot. 1126 Arch St is a home located in Alameda County with nearby schools including Cragmont Elementary School, Berkeley Arts Magnet at Whittier School, and Washington Elementary School.
Ownership History
Date
Name
Owned For
Owner Type
Purchase Details
Closed on
Jan 9, 2023
Sold by
Bilal & Irum Family Trust
Bought by
Hiz-Am Family Trust and Aftab
Current Estimated Value
Purchase Details
Closed on
Jul 6, 2020
Sold by
Musharraf Bilal and Musharraf Irum
Bought by
Musharraf Bilal and Musharraf Irum
Purchase Details
Closed on
Aug 8, 2019
Sold by
Mechanics Bank
Bought by
Musharraf Bilai and Musharraf Irum
Purchase Details
Closed on
Feb 20, 2015
Sold by
Kortegaard Barbara A
Bought by
Kortegaard Barbara A and The Barbara Kortegaard Living
Create a Home Valuation Report for This Property
The Home Valuation Report is an in-depth analysis detailing your home's value as well as a comparison with similar homes in the area
Home Values in the Area
Average Home Value in this Area
Purchase History
| Date | Buyer | Sale Price | Title Company |
|---|---|---|---|
| Hiz-Am Family Trust | -- | None Listed On Document | |
| Musharraf Bilal | -- | None Available | |
| Musharraf Bilai | $1,450,000 | Old Republic Title Company | |
| Kortegaard Barbara A | -- | None Available |
Source: Public Records
Tax History
| Year | Tax Paid | Tax Assessment Tax Assessment Total Assessment is a certain percentage of the fair market value that is determined by local assessors to be the total taxable value of land and additions on the property. | Land | Improvement |
|---|---|---|---|---|
| 2025 | $23,501 | $1,585,763 | $475,729 | $1,110,034 |
| 2024 | $23,501 | $1,554,674 | $466,402 | $1,088,272 |
| 2023 | $22,966 | $1,524,195 | $457,258 | $1,066,937 |
| 2022 | $22,521 | $1,494,311 | $448,293 | $1,046,018 |
| 2021 | $22,598 | $1,465,021 | $439,506 | $1,025,515 |
| 2020 | $21,640 | $1,450,000 | $435,000 | $1,015,000 |
| 2019 | $4,268 | $89,015 | $61,981 | $27,034 |
| 2018 | $4,131 | $87,270 | $60,766 | $26,504 |
| 2017 | $3,947 | $85,558 | $59,574 | $25,984 |
| 2016 | $3,645 | $83,881 | $58,406 | $25,475 |
| 2015 | $3,565 | $82,621 | $57,529 | $25,092 |
| 2014 | $3,418 | $81,003 | $56,402 | $24,601 |
Source: Public Records
Map
Nearby Homes
- 2315 Eunice St
- 1004 Cragmont Ave
- 2121 Eunice St
- 938 San Benito Rd
- 1106 Cragmont Ave
- 962 Regal Rd
- 1950 Hopkins St
- 2501 Rose Walk
- 1165 Cragmont Ave
- 2686 Shasta Rd
- 1155 Keeler Ave
- 1444 Walnut St
- 1110 Sterling Ave
- 813 San Diego Rd
- 1408 Henry St
- 1515 Oxford St Unit 1D
- 1024 Grizzly Peak Blvd
- 777 Cragmont Ave
- 758 Spruce St
- 1160 Miller Ave
Your Personal Tour Guide
Ask me questions while you tour the home.