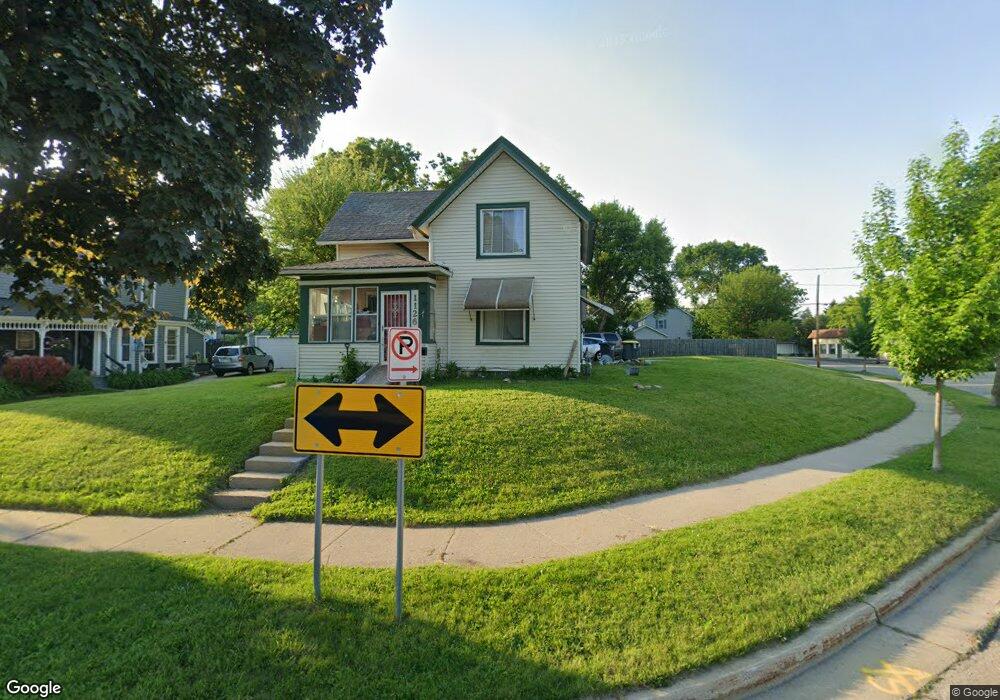
1126 Beechwood Ave Waukesha, WI 53186
Estimated Value: $250,000 - $282,649
2
Beds
2
Baths
1,076
Sq Ft
$248/Sq Ft
Est. Value
About This Home
This home is located at 1126 Beechwood Ave, Waukesha, WI 53186 and is currently estimated at $266,412, approximately $247 per square foot. 1126 Beechwood Ave is a home located in Waukesha County with nearby schools including Hadfield Elementary School, Horning Middle School, and South High School.
Ownership History
Date
Name
Owned For
Owner Type
Purchase Details
Closed on
Dec 23, 2009
Sold by
The Equitable Bank Ssb
Bought by
Sukowski Allan H
Current Estimated Value
Home Financials for this Owner
Home Financials are based on the most recent Mortgage that was taken out on this home.
Original Mortgage
$100,150
Outstanding Balance
$65,223
Interest Rate
4.87%
Mortgage Type
FHA
Estimated Equity
$201,189
Purchase Details
Closed on
Aug 19, 2009
Sold by
Johnson Jared S
Bought by
The Equitable Bank Ssb
Purchase Details
Closed on
Oct 25, 2004
Sold by
Griffin Robert J and Griffin Judith A
Bought by
Johnson Jared S
Home Financials for this Owner
Home Financials are based on the most recent Mortgage that was taken out on this home.
Original Mortgage
$132,500
Interest Rate
5.5%
Mortgage Type
Purchase Money Mortgage
Create a Home Valuation Report for This Property
The Home Valuation Report is an in-depth analysis detailing your home's value as well as a comparison with similar homes in the area
Home Values in the Area
Average Home Value in this Area
Purchase History
| Date | Buyer | Sale Price | Title Company |
|---|---|---|---|
| Sukowski Allan H | $102,000 | Priority Title Corporation | |
| The Equitable Bank Ssb | -- | None Available | |
| Johnson Jared S | $139,500 | -- |
Source: Public Records
Mortgage History
| Date | Status | Borrower | Loan Amount |
|---|---|---|---|
| Open | Sukowski Allan H | $100,150 | |
| Previous Owner | Johnson Jared S | $132,500 |
Source: Public Records
Tax History Compared to Growth
Tax History
| Year | Tax Paid | Tax Assessment Tax Assessment Total Assessment is a certain percentage of the fair market value that is determined by local assessors to be the total taxable value of land and additions on the property. | Land | Improvement |
|---|---|---|---|---|
| 2024 | $4,164 | $211,200 | $72,100 | $139,100 |
| 2023 | $3,995 | $211,200 | $72,100 | $139,100 |
| 2022 | $3,502 | $144,900 | $72,500 | $72,400 |
| 2021 | $3,575 | $144,900 | $72,500 | $72,400 |
| 2020 | $3,442 | $144,900 | $72,500 | $72,400 |
| 2019 | $3,340 | $144,900 | $72,500 | $72,400 |
| 2018 | $3,087 | $132,900 | $65,600 | $67,300 |
| 2017 | $3,060 | $132,900 | $65,600 | $67,300 |
| 2016 | $3,014 | $124,200 | $62,100 | $62,100 |
| 2015 | $2,983 | $124,200 | $62,100 | $62,100 |
| 2014 | $2,474 | $123,000 | $62,100 | $60,900 |
| 2013 | $2,474 | $123,000 | $62,100 | $60,900 |
Source: Public Records
Map
Nearby Homes
- 1103 Arcadian Ave
- 1021 Arcadian Ave
- 930 Harding Ave
- 953 Genesee St
- 403 Midland Ave
- 1219 National Ave
- 1021 Aurora St
- 1343 Hillside Dr
- S21W23079 Hillside Dr
- 512 E Main St
- 1139 White Rock Ave
- 125 Tenny Ave
- 100 E Main St Unit 403
- 100 E Main St Unit 307
- 1349 Rose Ct Unit 62
- 918 Niagara St
- W230S2425 Morningside Dr
- 1333 Niagara St
- S17W22650 Lincoln Ave
- 131 Wisconsin Ave
- 1205 Beechwood Ave
- 1119 Beechwood Ave
- 1209 Beechwood Ave
- 1203 Beechwood Ave
- 1120 Beechwood Ave
- 1115 Beechwood Ave
- 1114 Beechwood Ave
- 1111 Beechwood Ave
- 1106 Beechwood Ave
- 1107 Beechwood Ave
- 1212 Beechwood Ave
- 1103 Beechwood Ave
- 1123 Anoka Ave
- 1021 Beechwood Ave
- 1020 Beechwood Ave
- 1125 Anoka Ave
- 1128 Anoka Ave
- 1124 Anoka Ave
- 1119 Anoka Ave
- 1122 Linden St