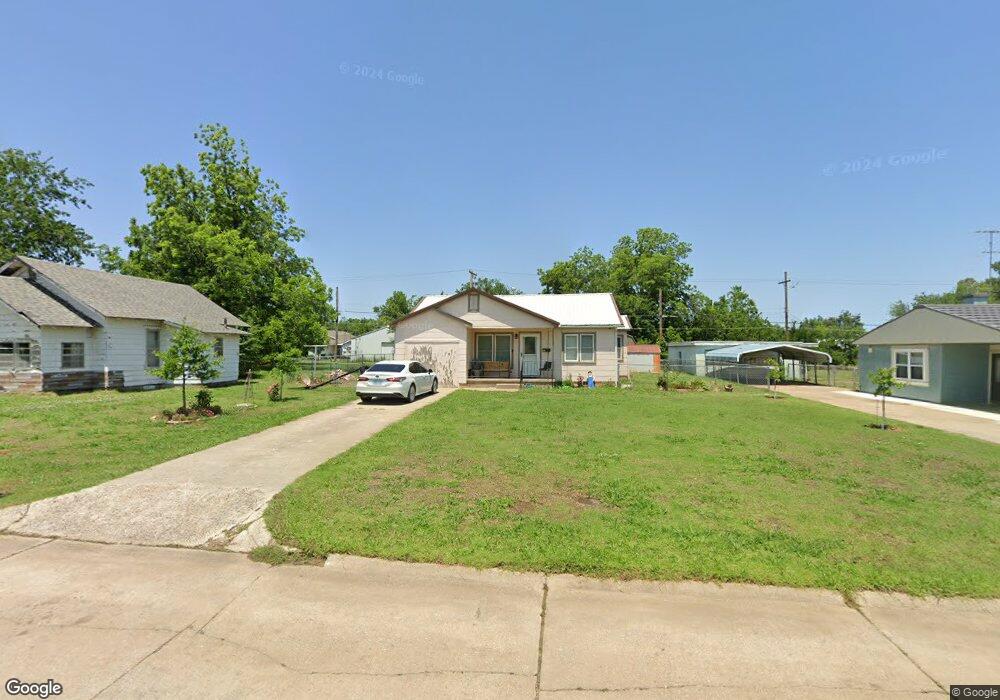
1126 E Cherry St Cushing, OK 74023
Estimated Value: $111,000 - $163,000
3
Beds
2
Baths
1,375
Sq Ft
$94/Sq Ft
Est. Value
About This Home
This home is located at 1126 E Cherry St, Cushing, OK 74023 and is currently estimated at $129,715, approximately $94 per square foot. 1126 E Cherry St is a home with nearby schools including Cushing Upper Elementary School, Cushing Lower Elementary School, and Cushing High School.
Ownership History
Date
Name
Owned For
Owner Type
Purchase Details
Closed on
Oct 28, 2025
Sold by
Carrasco Iram and Lozoya Diana Josefina
Bought by
Vieyra Imelda
Current Estimated Value
Purchase Details
Closed on
Sep 17, 2024
Sold by
Board Of Education School District 67 and Independent School District No 67
Bought by
Mash Development Llc
Purchase Details
Closed on
Jun 2, 2022
Sold by
Agril Ferguson
Bought by
Carrasco Irum and Vieyra Imelda
Purchase Details
Closed on
Sep 17, 2018
Sold by
Hernandez Daniel R
Bought by
Carrasco Iram
Purchase Details
Closed on
Jul 27, 2018
Sold by
Hernandez Annie L
Bought by
Hernandez Daniel R
Create a Home Valuation Report for This Property
The Home Valuation Report is an in-depth analysis detailing your home's value as well as a comparison with similar homes in the area
Purchase History
| Date | Buyer | Sale Price | Title Company |
|---|---|---|---|
| Vieyra Imelda | -- | None Listed On Document | |
| Mash Development Llc | -- | Octs | |
| Mash Development Llc | -- | Octs | |
| Carrasco Irum | $90,000 | None Listed On Document | |
| Carrasco Iram | -- | -- | |
| Hernandez Daniel R | -- | -- |
Source: Public Records
Tax History
| Year | Tax Paid | Tax Assessment Tax Assessment Total Assessment is a certain percentage of the fair market value that is determined by local assessors to be the total taxable value of land and additions on the property. | Land | Improvement |
|---|---|---|---|---|
| 2025 | $627 | $6,737 | $340 | $6,397 |
| 2024 | $571 | $6,737 | $340 | $6,397 |
| 2023 | $571 | $6,416 | $445 | $5,971 |
| 2022 | $521 | $6,111 | $495 | $5,616 |
| 2021 | $483 | $5,820 | $509 | $5,311 |
| 2020 | $454 | $5,543 | $466 | $5,077 |
| 2019 | $452 | $5,279 | $741 | $4,538 |
| 2018 | $438 | $5,279 | $741 | $4,538 |
| 2017 | $435 | $5,279 | $741 | $4,538 |
| 2016 | $446 | $5,279 | $741 | $4,538 |
| 2015 | $515 | $5,949 | $779 | $5,170 |
| 2014 | -- | $5,949 | $779 | $5,170 |
Source: Public Records
Map
Nearby Homes
- 1217 E Cherry St
- 1224 E Cherry St
- 112 S Highland Ave
- 1301 E Ash St
- 1002 E Cherry St
- 1318 E Oak St
- 508 S Michigan Ave
- 919 E 2nd St
- 1003 E 4th St
- 915 E Oak St
- 933 E Maple St
- 1436 E Moses St
- 1417 E Oak St
- 1441 E Cherry St
- 1501 E Moses St
- 843 E 4th St
- 1236 E Main St
- 1107 E 8th St
- 1515 E Oak St
- 732 E Broadway St
- 1120 E Cherry St
- 1138 E Cherry St
- 1118 E Cherry St
- 121 S Howerton Ave
- 1135 E Broadway St
- 1137 E Broadway St
- 1116 E Cherry St
- 1115 E Broadway St
- 1115 E Cherry St
- 1139 E Broadway St
- 1108 E Cherry St
- 1111 E Broadway St
- 1208 E Cherry St
- 1212 E Cherry St
- 1109 E Broadway St
- 1107 E Cherry St
- 1106 E Cherry St
- 1201 E Cherry St
- 1107 E Broadway St
- 1105 E Cherry St
Your Personal Tour Guide
Ask me questions while you tour the home.