1126 Las Posas Unit U2 San Clemente, CA 92673
Forster Ranch NeighborhoodEstimated Value: $1,290,000 - $1,459,000
3
Beds
3
Baths
2,350
Sq Ft
$590/Sq Ft
Est. Value
About This Home
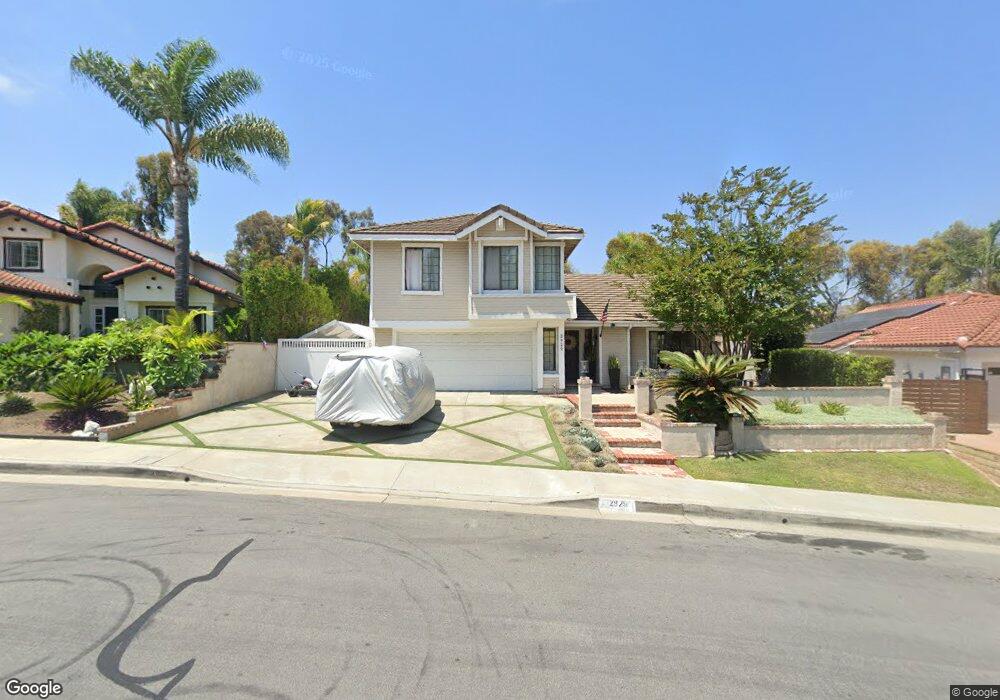
This home is located at 1126 Las Posas Unit U2, San Clemente, CA 92673 and is currently estimated at $1,385,990, approximately $589 per square foot. 1126 Las Posas Unit U2 is a home located in Orange County with nearby schools including Truman Benedict Elementary School, Bernice Ayer Middle School, and San Clemente High School.
Ownership History
Date
Name
Owned For
Owner Type
Purchase Details
Closed on
Jun 7, 2023
Sold by
Edwards Robert W and Edwards Carol L
Bought by
Edwards Living Trust and Edwards
Current Estimated Value
Purchase Details
Closed on
Oct 30, 2003
Sold by
Edwards Robert W
Bought by
Edwards Robert W and Edwards Carol
Purchase Details
Closed on
Jan 29, 1999
Sold by
Craig Baptiste and Craig Denise
Bought by
Edwards Robert W
Home Financials for this Owner
Home Financials are based on the most recent Mortgage that was taken out on this home.
Original Mortgage
$215,000
Interest Rate
6.78%
Purchase Details
Closed on
Dec 19, 1997
Sold by
Craig Baptiste
Bought by
Baptiste Craig and Baptiste Denise
Home Financials for this Owner
Home Financials are based on the most recent Mortgage that was taken out on this home.
Original Mortgage
$205,000
Interest Rate
6.45%
Create a Home Valuation Report for This Property
The Home Valuation Report is an in-depth analysis detailing your home's value as well as a comparison with similar homes in the area
Home Values in the Area
Average Home Value in this Area
Purchase History
| Date | Buyer | Sale Price | Title Company |
|---|---|---|---|
| Edwards Living Trust | -- | None Listed On Document | |
| Edwards Robert W | -- | -- | |
| Edwards Robert W | $330,000 | Golden California Title Co | |
| Baptiste Craig | -- | South Coast Title Company |
Source: Public Records
Mortgage History
| Date | Status | Borrower | Loan Amount |
|---|---|---|---|
| Previous Owner | Edwards Robert W | $215,000 | |
| Previous Owner | Baptiste Craig | $205,000 |
Source: Public Records
Tax History Compared to Growth
Tax History
| Year | Tax Paid | Tax Assessment Tax Assessment Total Assessment is a certain percentage of the fair market value that is determined by local assessors to be the total taxable value of land and additions on the property. | Land | Improvement |
|---|---|---|---|---|
| 2025 | $5,148 | $517,334 | $208,084 | $309,250 |
| 2024 | $5,148 | $507,191 | $204,004 | $303,187 |
| 2023 | $5,039 | $497,247 | $200,004 | $297,243 |
| 2022 | $4,943 | $487,498 | $196,083 | $291,415 |
| 2021 | $4,848 | $477,940 | $192,239 | $285,701 |
| 2020 | $4,800 | $473,040 | $190,268 | $282,772 |
| 2019 | $4,705 | $463,765 | $186,537 | $277,228 |
| 2018 | $4,615 | $454,672 | $182,879 | $271,793 |
| 2017 | $4,525 | $445,757 | $179,293 | $266,464 |
| 2016 | $4,439 | $437,017 | $175,777 | $261,240 |
| 2015 | $4,372 | $430,453 | $173,137 | $257,316 |
| 2014 | $4,288 | $422,022 | $169,746 | $252,276 |
Source: Public Records
Map
Nearby Homes
- 6 Avenida Fortuna
- 1205 Cerca
- 1200 Cerca
- 110 Del Cabo Unit C34
- 2846 Calle Esteban
- 145 Mira Del Norte
- 53 Mira Las Olas
- 2878 Riachuelo
- 101 Mira Adelante Unit 101
- 41 Mira Las Olas
- 1302 Cadena
- 2933 Via Blanco
- 2205 Via Iris
- 14 Tesoro
- 703 Calle Cumbre
- 4 Via Del Tesoro
- 3202 Portico Del Norte
- 28101 Pacifica Del Mar
- 3 Calle Agua
- 5417 Camino Mojado
- 1122 Las Posas
- 1120 Las Posas
- 1118 Las Posas Unit U6
- 1116 Las Posas
- 1114 Las Posas
- 2936 Arroyo
- 2938 Arroyo
- 1112 Las Posas
- 1110 Las Posas
- 2934 Arroyo
- 1108 Las Posas Unit 11
- 1106 Las Posas
- 2940 Arroyo
- 1104 Las Posas
- 2932 Arroyo
- 1102 Las Posas
- 2927 Calle Heraldo
- 1100 Las Posas Unit 15
- 2930 Arroyo
- 2929 Calle Heraldo