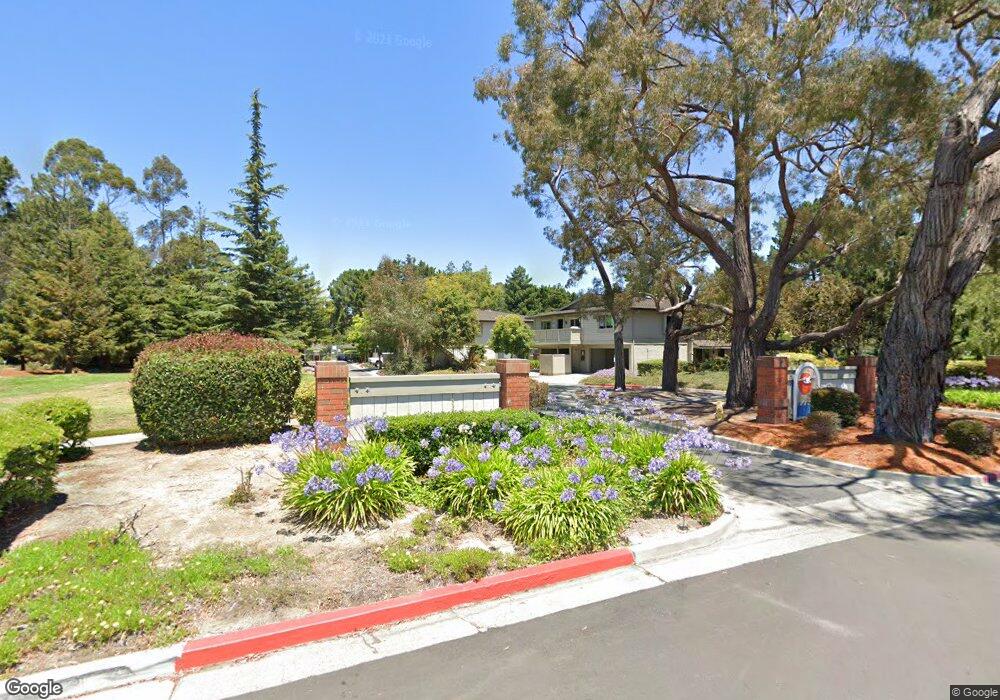
1126 Sutherland Ln Unit 4 Capitola, CA 95010
Estimated Value: $629,132 - $720,000
3
Beds
1
Bath
979
Sq Ft
$683/Sq Ft
Est. Value
About This Home
This home is located at 1126 Sutherland Ln Unit 4, Capitola, CA 95010 and is currently estimated at $668,283, approximately $682 per square foot. 1126 Sutherland Ln Unit 4 is a home located in Santa Cruz County with nearby schools including Main Street Elementary School, New Brighton Middle School, and Mission Hill Middle School.
Ownership History
Date
Name
Owned For
Owner Type
Purchase Details
Closed on
Mar 23, 2022
Sold by
Bourque James A
Bought by
James A Bourque And Jill Bourque 2022 Revocab
Current Estimated Value
Purchase Details
Closed on
Oct 20, 2010
Sold by
Bourque Jill
Bought by
Bourque James A and Bourque Jill
Purchase Details
Closed on
Oct 15, 2010
Sold by
Katsuda Francis A and Katsuda Jan
Bought by
Katsuda Francis A and Katsuda Jan
Purchase Details
Closed on
Oct 12, 2010
Sold by
Katsuda Jan
Bought by
Katsuda Francis A and Katsuda Jan
Purchase Details
Closed on
Aug 19, 1999
Sold by
Hollingshead Ernest S
Bought by
Hollingshead Ernest S and Katsuda Jan
Purchase Details
Closed on
Oct 20, 1990
Sold by
Hollingshead Ernest S
Bought by
Hollingshead Ernest S and Hollingshead Betty J
Create a Home Valuation Report for This Property
The Home Valuation Report is an in-depth analysis detailing your home's value as well as a comparison with similar homes in the area
Home Values in the Area
Average Home Value in this Area
Purchase History
| Date | Buyer | Sale Price | Title Company |
|---|---|---|---|
| James A Bourque And Jill Bourque 2022 Revocab | -- | Sinclair Wilson Baldo & Chambe | |
| Bourque James A | -- | None Available | |
| Katsuda Francis A | -- | None Available | |
| Katsuda Francis A | -- | None Available | |
| Katsuda Jan | -- | None Available | |
| Hollingshead Ernest S | -- | -- | |
| Hollingshead Ernest S | -- | Valley Title Company |
Source: Public Records
Tax History
| Year | Tax Paid | Tax Assessment Tax Assessment Total Assessment is a certain percentage of the fair market value that is determined by local assessors to be the total taxable value of land and additions on the property. | Land | Improvement |
|---|---|---|---|---|
| 2025 | $2,065 | $91,346 | $25,134 | $66,212 |
| 2023 | $1,986 | $87,800 | $24,158 | $63,642 |
| 2022 | $1,930 | $86,078 | $23,684 | $62,394 |
| 2021 | $1,860 | $84,390 | $23,220 | $61,170 |
| 2020 | $1,822 | $83,524 | $22,982 | $60,542 |
| 2019 | $1,726 | $76,886 | $22,530 | $54,356 |
| 2018 | $1,678 | $75,380 | $22,090 | $53,290 |
| 2017 | $1,645 | $73,900 | $21,654 | $52,246 |
| 2016 | $1,568 | $72,452 | $21,230 | $51,222 |
Source: Public Records
Map
Nearby Homes
- 1009 Sir Francis Ave
- 922 Ponselle Ln Unit 3
- 213 Cortez St
- 2603 Willowbrook Ln Unit 22
- 17 Pepperwood Way Unit 17
- 5606 Soquel Dr
- 2607 Willowbrook Ln Unit 58
- 2607 Willowbrook Ln Unit 54
- 27 Pepperwood Way Unit 27
- 103 Darlington Ln
- 109 Darlington Ln
- 115 Darlington Ln
- 6125 Abbey Rd
- 2623 Willowbrook Ln Unit 118
- 105 Wesley St
- 300 Plum St Unit 23
- 930 Rosedale Ave Unit 68
- 930 Rosedale Ave Unit 64
- 3233 Maplethorpe Ln
- 620 El Salto Dr
- 1126 Sutherland Ln Unit 3
- 1126 Sutherland Ln Unit 2
- 1126 Sutherland Ln Unit 1
- 1122 Sutherland Ln Unit 4
- 1122 Sutherland Ln Unit 3
- 1122 Sutherland Ln Unit 2
- 1122 Sutherland Ln Unit 1
- 1118 Sutherland Ln Unit 4
- 1118 Sutherland Ln Unit 3
- 1118 Sutherland Ln Unit 2
- 1118 Sutherland Ln Unit 1
- 1118 Callas Ln Unit 2
- 1118 Callas Ln Unit 4
- 1118 Callas Ln Unit 3
- 1118 Callas Ln Unit 1
- 1125 Sutherland Ln Unit 1
- 1125 Sutherland Ln Unit 2
- 1125 Sutherland Ln Unit 3
- 1125 Sutherland Ln Unit 4
- 1121 Sutherland Ln Unit 4
Your Personal Tour Guide
Ask me questions while you tour the home.