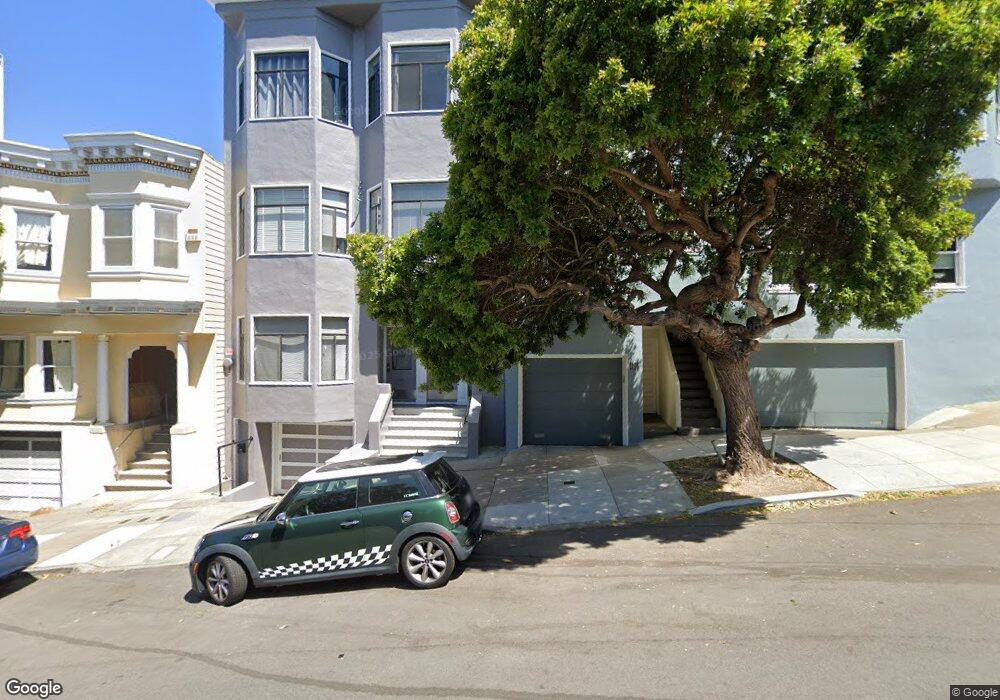
1126 Vallejo St Unit 1130 San Francisco, CA 94109
Russian Hill NeighborhoodEstimated Value: $1,827,000 - $2,386,000
--
Bed
3
Baths
4,200
Sq Ft
$484/Sq Ft
Est. Value
About This Home
This home is located at 1126 Vallejo St Unit 1130, San Francisco, CA 94109 and is currently estimated at $2,031,333, approximately $483 per square foot. 1126 Vallejo St Unit 1130 is a home located in San Francisco County with nearby schools including Yick Wo Elementary School, Francisco Middle School, and Sts. Peter And Paul K-8.
Ownership History
Date
Name
Owned For
Owner Type
Purchase Details
Closed on
May 29, 2024
Sold by
Chan Stacey
Bought by
Stacey Chan Revocable Agreement Of Trust and Chan
Current Estimated Value
Purchase Details
Closed on
Aug 1, 2022
Sold by
Corey Chan
Bought by
Chan 2002 Family Trust
Purchase Details
Closed on
Jan 31, 2022
Sold by
Barney Chan
Bought by
Barney T Chan Revocable Separate Property Tru
Purchase Details
Closed on
Oct 5, 2018
Sold by
Chan Barney
Bought by
Chan Barney and Chan Corey
Purchase Details
Closed on
Nov 28, 2017
Sold by
Morell Marilz Blanca
Bought by
Morell Ramon Rraymundo
Purchase Details
Closed on
May 24, 2016
Sold by
Chan Esther L
Bought by
Chan Esther Lee
Purchase Details
Closed on
May 1, 2016
Sold by
Cheung Yuk Fan
Bought by
Cheung Yuk Fan
Create a Home Valuation Report for This Property
The Home Valuation Report is an in-depth analysis detailing your home's value as well as a comparison with similar homes in the area
Home Values in the Area
Average Home Value in this Area
Purchase History
| Date | Buyer | Sale Price | Title Company |
|---|---|---|---|
| Stacey Chan Revocable Agreement Of Trust | -- | None Listed On Document | |
| Chan 2002 Family Trust | -- | Law Offices Of Ernest Lew | |
| Barney T Chan Revocable Separate Property Tru | -- | Law Fong Leung Lee & Chan | |
| Chan Barney | -- | None Available | |
| Morell Ramon Rraymundo | $400,000 | Old Republic Title Co | |
| Chan Esther Lee | -- | None Available | |
| Cheung Yuk Fan | -- | None Available |
Source: Public Records
Tax History Compared to Growth
Tax History
| Year | Tax Paid | Tax Assessment Tax Assessment Total Assessment is a certain percentage of the fair market value that is determined by local assessors to be the total taxable value of land and additions on the property. | Land | Improvement |
|---|---|---|---|---|
| 2025 | $5,833 | $392,576 | $117,732 | $274,844 |
| 2024 | $5,833 | $384,882 | $115,426 | $269,456 |
| 2023 | $5,605 | $377,337 | $113,163 | $264,174 |
| 2022 | $5,443 | $369,942 | $110,947 | $258,995 |
| 2021 | $5,348 | $362,691 | $108,773 | $253,918 |
| 2020 | $5,538 | $358,979 | $107,661 | $251,318 |
| 2019 | $5,369 | $351,944 | $105,553 | $246,391 |
| 2018 | $5,192 | $345,112 | $103,520 | $241,592 |
| 2017 | $4,838 | $338,348 | $101,492 | $236,856 |
| 2016 | $4,728 | $331,745 | $99,517 | $232,228 |
| 2015 | $4,664 | $326,763 | $98,023 | $228,740 |
| 2014 | $4,552 | $320,363 | $96,103 | $224,260 |
Source: Public Records
Map
Nearby Homes
- 1070 Green St Unit 801
- 1101 Green St Unit 1801
- 999 Green St Unit 1501
- 999 Green St Unit 2001
- 1925 Leavenworth St Unit 7
- 1135 Green St
- 1145 Green St Unit 3
- 1950 Jones St
- 1250 Vallejo St Unit 7
- 1250 Vallejo St Unit 9
- 1725 Jones St Unit 3
- 1020 Union St Unit 19
- 947 Green St Unit 6
- 1100 Union St Unit 1100
- 1100 Union St Unit 1000
- 16 Delgado Place
- 164 Bernard St
- 1750 Taylor St Unit 2202
- 1750 Taylor St Unit 1901
- 1750 Taylor St Unit 1401
- 1132 Vallejo St Unit 1134
- 1140 Vallejo St Unit 1144
- 1122 Vallejo St
- 1120 Vallejo St
- 1821 Jones St
- 1146 Vallejo St
- 1809 Jones St
- 1807 Jones St
- 1827 Jones St Unit 1831
- 1148 Vallejo St
- 1150 Vallejo St Unit 1152
- 1801 Jones St Unit 1803
- 1833 Jones St
- 1156 Vallejo St Unit 101
- 1156 Vallejo St Unit 200
- 1156 Vallejo St Unit 1160
- 1160 Vallejo St
- 1033 Green St
- 1039 Green St
- 1162 Vallejo St Unit 1164