
Landlord's Agent in 2015
Gina Poindexter
Samson Properties
(703) 400-8754
30 Total Sales

Estimated Value: $228,428 - $310,000
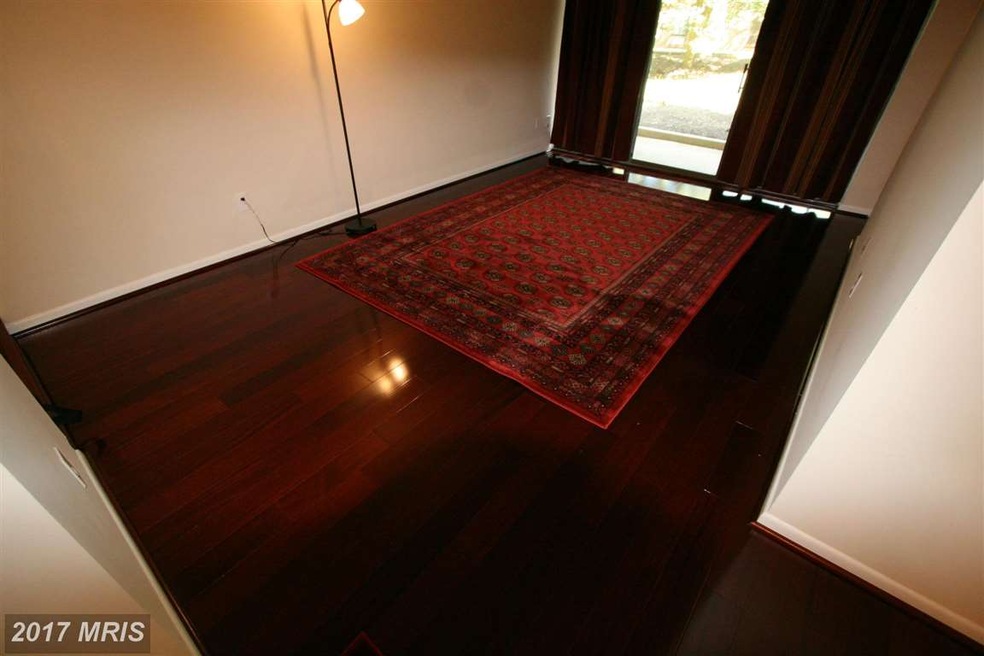
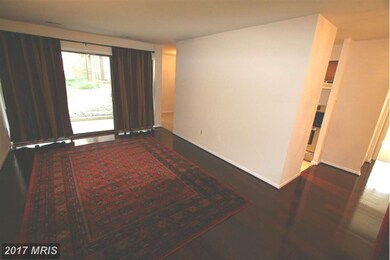
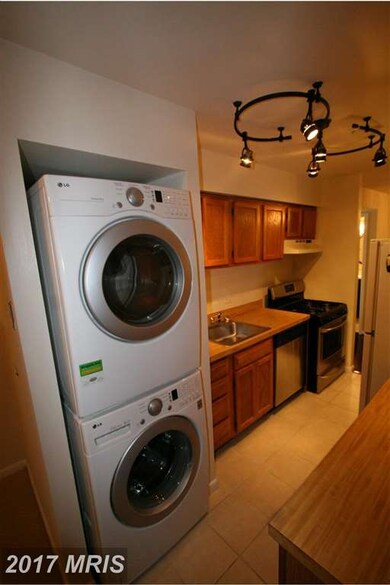
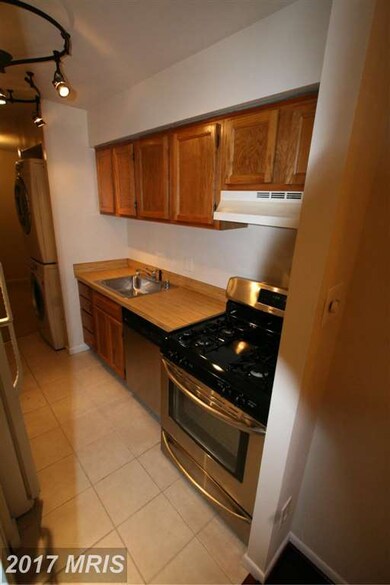
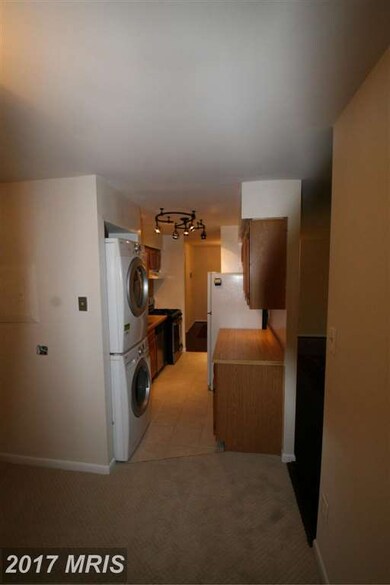
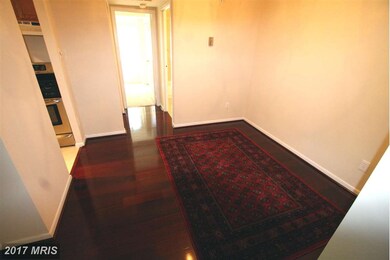
UTILITIES INCLUDED! CLOSEST Community TO SILVER Line METRO! Brand New & Beautiful Mahogany Wood Floor in Living/Dining, PATIO, Ceramic Tile in Upgraded Kitchen & Bath, Spacious Bedroom! Extra Room off Kitchen for Family/Den, Office, or whatever desired! WALK TO METRO!(1/2 Mile) New Carpet in Bedroom and Family/Den, Freshly Painted! MOVE-IN READY! BEST PRICE IN TOWN! WONT LAST!
Last Agent to Rent the Property
(703) 400-8754 ginapoindexter@gmail.com Samson Properties License #0225097090 Listed on: 08/03/2015
Home Type
Condominium
Est. Annual Taxes
$2,720
Year Built
1972
Lot Details
0
| Date | Buyer | Sale Price | Title Company |
|---|---|---|---|
| Colson Timothy M | $220,000 | Psr Title Llc | |
| Metzner Kenneth J | $77,000 | -- |
| Date | Status | Borrower | Loan Amount |
|---|---|---|---|
| Open | Colson Timothy M | $227,260 |
| Date | Event | Price | List to Sale | Price per Sq Ft |
|---|---|---|---|---|
| 09/30/2015 09/30/15 | Rented | $1,350 | 0.0% | -- |
| 09/28/2015 09/28/15 | Price Changed | $1,350 | -3.6% | $2 / Sq Ft |
| 09/20/2015 09/20/15 | For Rent | $1,400 | 0.0% | -- |
| 09/18/2015 09/18/15 | Under Contract | -- | -- | -- |
| 09/15/2015 09/15/15 | Price Changed | $1,400 | -3.4% | $2 / Sq Ft |
| 08/30/2015 08/30/15 | Price Changed | $1,450 | -6.5% | $2 / Sq Ft |
| 08/03/2015 08/03/15 | For Rent | $1,550 | -- | -- |
| Year | Tax Paid | Tax Assessment Tax Assessment Total Assessment is a certain percentage of the fair market value that is determined by local assessors to be the total taxable value of land and additions on the property. | Land | Improvement |
|---|---|---|---|---|
| 2025 | $2,720 | $223,370 | $45,000 | $178,370 |
| 2024 | $2,720 | $225,630 | $45,000 | $180,630 |
| 2023 | $2,456 | $208,920 | $42,000 | $166,920 |
| 2022 | $2,324 | $195,250 | $39,000 | $156,250 |
| 2021 | $2,457 | $201,290 | $40,000 | $161,290 |
| 2020 | $2,272 | $184,670 | $37,000 | $147,670 |
| 2019 | $2,272 | $184,670 | $37,000 | $147,670 |
| 2018 | $2,124 | $184,670 | $37,000 | $147,670 |
| 2017 | $2,401 | $198,790 | $40,000 | $158,790 |
| 2016 | $2,299 | $190,680 | $38,000 | $152,680 |
| 2015 | $2,315 | $199,040 | $40,000 | $159,040 |
| 2014 | $2,310 | $199,040 | $40,000 | $159,040 |
Landlord's Agent in 2015
Gina Poindexter
Samson Properties
(703) 400-8754
30 Total Sales
Tenant's Agent in 2015
Jason Pogue
National Realty, LLC
(703) 901-6018
2 Total Sales
Source: Bright MLS
MLS Number: FX8711281
APN: 0174-22-0022
Disclaimer: Certain information contained herein is derived from information provided by parties other than Homes.com. All information provided is deemed reliable, but is not guaranteed to be accurate and should be independently verified.
![]() The data relating to real estate for sale on this website appears in part through the BRIGHT Internet Data Exchange program, a voluntary cooperative exchange of property listing data between licensed real estate brokerage firms, and is provided by BRIGHT through a licensing agreement.
The data relating to real estate for sale on this website appears in part through the BRIGHT Internet Data Exchange program, a voluntary cooperative exchange of property listing data between licensed real estate brokerage firms, and is provided by BRIGHT through a licensing agreement.
Listing information is from various brokers who participate in the Bright MLS IDX program and not all listings may be visible on the site.
The property information being provided on or through the website is for the personal, non-commercial use of consumers and such information may not be used for any purpose other than to identify prospective properties consumers may be interested in purchasing.
Some properties which appear for sale on the website may no longer be available because they are for instance, under contract, sold or are no longer being offered for sale.
Property information displayed is deemed reliable but is not guaranteed.
Copyright 2025 Bright MLS, Inc.