
Seller's Agent in 2023
Joshua Vida
Paradigm Realty Solutions
(574) 626-8432
23 in this area
740 Total Sales

Estimated Value: $366,000 - $380,420
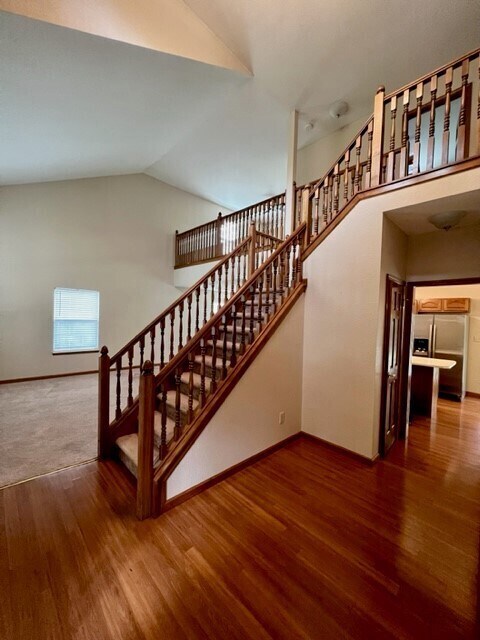
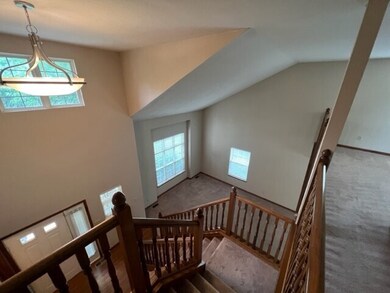
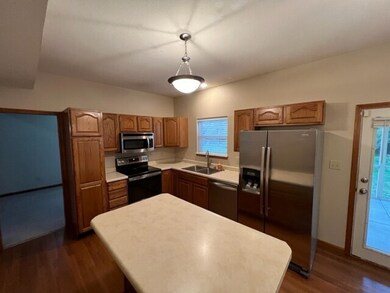
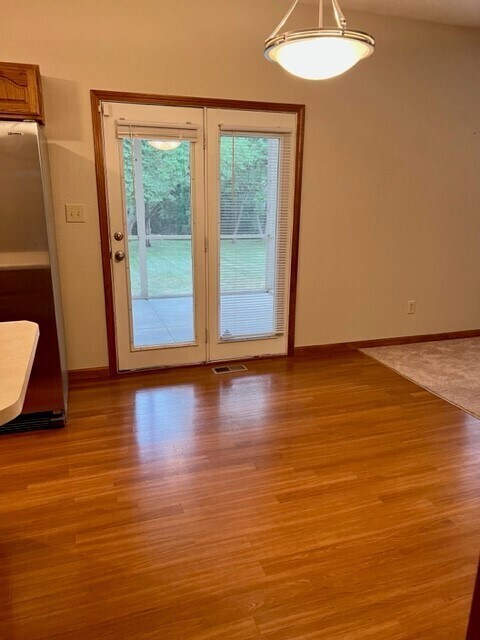
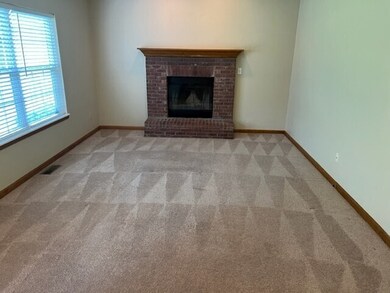
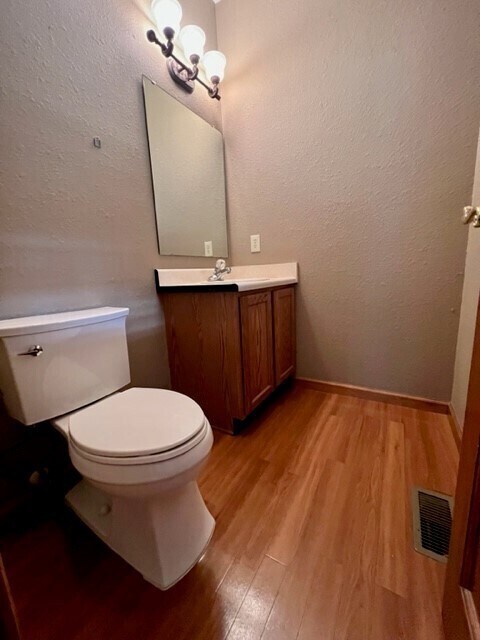
Wow, what a view! Super clean 3 beds and large Loft with 2.5 bath 2-story in popular wildwood estates! Open floorplan w/ large living room, dining room/office & spacious eat-in kitchen! nicely appointed bedrooms & spacious primary & bath upstairs! Roll out of your kitchen to your huge screened-in porch! New hvac & water heater. updated roof. great curb appeal, private street! wildwood estates is just minutes from everything fishers!
Last Agent to Sell the Property
Paradigm Realty Solutions Brokerage Email: jvida@realtyparadigm.com License #RB14030173 Listed on: 07/22/2023
Last Buyer's Agent
Xuesong Yan
Best Value Realty LLC
| Date | Buyer | Sale Price | Title Company |
|---|---|---|---|
| Dong Jiannan | -- | Near North Title Group | |
| Dong Jiannan | $328,000 | Near North Title Group | |
| Baibo Matthew | -- | First American Title | |
| Szymanski Nick | -- | Chicago Title Insurance Co | |
| Laucks Matthew J | -- | Landmark Title Company |
| Date | Status | Borrower | Loan Amount |
|---|---|---|---|
| Open | Dong Jiannan | $262,400 | |
| Closed | Dong Jiannan | $262,400 | |
| Previous Owner | Baibo Matthew | $160,000 | |
| Previous Owner | Szymanski Nick | $177,493 | |
| Previous Owner | Laucks Matthew J | $153,900 |
| Date | Event | Price | List to Sale | Price per Sq Ft |
|---|---|---|---|---|
| 10/02/2023 10/02/23 | Sold | $328,000 | -4.9% | $154 / Sq Ft |
| 08/28/2023 08/28/23 | Pending | -- | -- | -- |
| 08/18/2023 08/18/23 | Price Changed | $344,900 | -2.8% | $162 / Sq Ft |
| 08/03/2023 08/03/23 | Price Changed | $354,900 | -2.8% | $167 / Sq Ft |
| 07/22/2023 07/22/23 | For Sale | $364,984 | -- | $172 / Sq Ft |
| Year | Tax Paid | Tax Assessment Tax Assessment Total Assessment is a certain percentage of the fair market value that is determined by local assessors to be the total taxable value of land and additions on the property. | Land | Improvement |
|---|---|---|---|---|
| 2024 | $3,741 | $333,300 | $84,000 | $249,300 |
| 2023 | $3,741 | $331,300 | $66,000 | $265,300 |
| 2022 | $6,362 | $285,300 | $66,000 | $219,300 |
| 2021 | $5,810 | $253,800 | $63,800 | $190,000 |
| 2020 | $5,387 | $233,000 | $63,800 | $169,200 |
| 2019 | $5,036 | $216,700 | $35,300 | $181,400 |
| 2018 | $4,700 | $202,500 | $35,300 | $167,200 |
| 2017 | $4,617 | $200,800 | $35,300 | $165,500 |
| 2016 | $4,503 | $197,000 | $35,300 | $161,700 |
| 2014 | $3,963 | $184,300 | $35,300 | $149,000 |
| 2013 | $3,963 | $174,200 | $35,300 | $138,900 |
Seller's Agent in 2023
Joshua Vida
Paradigm Realty Solutions
(574) 626-8432
23 in this area
740 Total Sales
X
Buyer's Agent in 2023
Xuesong Yan
Best Value Realty LLC
Source: MIBOR Broker Listing Cooperative®
MLS Number: 21933648
APN: 29-14-02-103-020.000-006
Disclaimer: Certain information contained herein is derived from information provided by parties other than Homes.com. All information provided is deemed reliable, but is not guaranteed to be accurate and should be independently verified.
![]() Based on information submitted to the MLS GRID. All data is obtained from various sources and may not have been verified by broker or MLS GRID. Supplied Open House Information is subject to change without notice. All information should be independently reviewed and verified for accuracy. Properties may or may not be listed by the office/agent presenting the information. Some IDX listings have been excluded from this website.
Based on information submitted to the MLS GRID. All data is obtained from various sources and may not have been verified by broker or MLS GRID. Supplied Open House Information is subject to change without notice. All information should be independently reviewed and verified for accuracy. Properties may or may not be listed by the office/agent presenting the information. Some IDX listings have been excluded from this website.