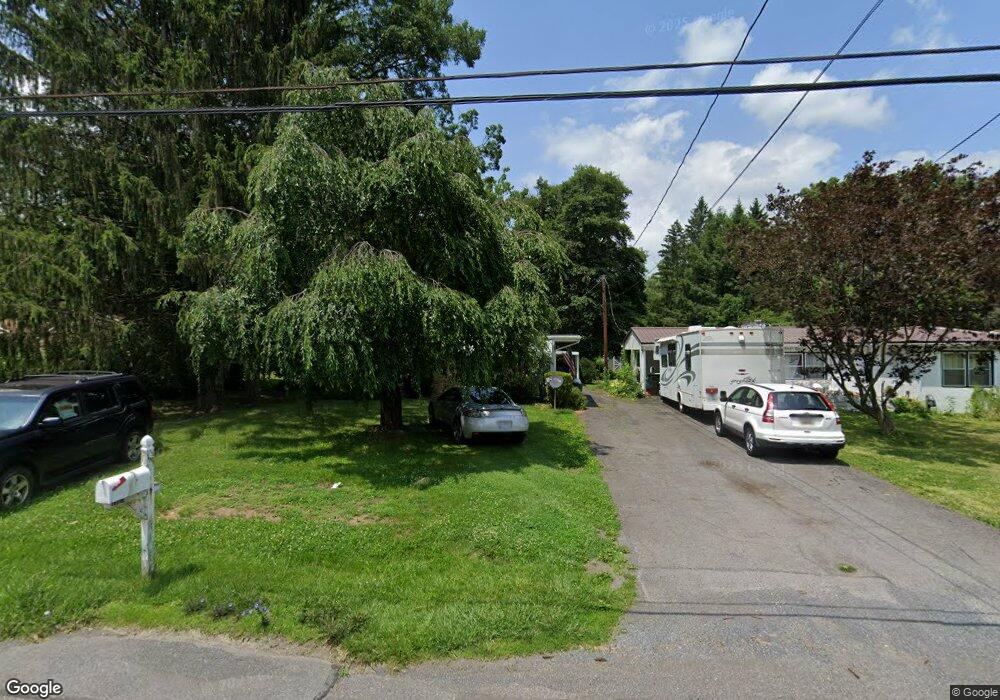
1127 Braddock Rd Cumberland, MD 21502
Estimated Value: $132,000 - $200,000
Studio
1
Bath
1,136
Sq Ft
$141/Sq Ft
Est. Value
About This Home
This home is located at 1127 Braddock Rd, Cumberland, MD 21502 and is currently estimated at $159,883, approximately $140 per square foot. 1127 Braddock Rd is a home located in Allegany County with nearby schools including Parkside Elementary School, Braddock Middle School, and Allegany High School.
Ownership History
Date
Name
Owned For
Owner Type
Purchase Details
Closed on
Apr 3, 2006
Sold by
Kayne Yvette
Bought by
Wariner Eric W
Current Estimated Value
Home Financials for this Owner
Home Financials are based on the most recent Mortgage that was taken out on this home.
Original Mortgage
$102,047
Outstanding Balance
$58,304
Interest Rate
6.26%
Mortgage Type
VA
Estimated Equity
$101,579
Purchase Details
Closed on
Mar 23, 2006
Sold by
Kayne Yvette
Bought by
Wariner Eric W
Home Financials for this Owner
Home Financials are based on the most recent Mortgage that was taken out on this home.
Original Mortgage
$102,047
Outstanding Balance
$58,304
Interest Rate
6.26%
Mortgage Type
VA
Estimated Equity
$101,579
Purchase Details
Closed on
Sep 21, 2004
Sold by
Gillum Robert B
Bought by
Kayne Yvette
Purchase Details
Closed on
Aug 26, 2003
Sold by
Gillum Robert B and Gillum Margaret S
Bought by
Gillum Robert B
Purchase Details
Closed on
Sep 8, 1994
Sold by
Gillum Bernard L
Bought by
Gillum Robert and Gillum Robert B
Create a Home Valuation Report for This Property
The Home Valuation Report is an in-depth analysis detailing your home's value as well as a comparison with similar homes in the area
Home Values in the Area
Average Home Value in this Area
Purchase History
| Date | Buyer | Sale Price | Title Company |
|---|---|---|---|
| Wariner Eric W | $99,900 | -- | |
| Wariner Eric W | $99,900 | -- | |
| Kayne Yvette | $69,900 | -- | |
| Gillum Robert B | -- | -- | |
| Gillum Robert | -- | -- |
Source: Public Records
Mortgage History
| Date | Status | Borrower | Loan Amount |
|---|---|---|---|
| Open | Wariner Eric W | $102,047 | |
| Closed | Wariner Eric W | $102,047 | |
| Closed | Kayne Yvette | -- |
Source: Public Records
Tax History
| Year | Tax Paid | Tax Assessment Tax Assessment Total Assessment is a certain percentage of the fair market value that is determined by local assessors to be the total taxable value of land and additions on the property. | Land | Improvement |
|---|---|---|---|---|
| 2025 | $1,254 | $114,833 | $0 | $0 |
| 2024 | $1,183 | $107,100 | $20,400 | $86,700 |
| 2023 | $1,018 | $100,033 | $0 | $0 |
| 2022 | $1,087 | $92,967 | $0 | $0 |
| 2021 | $1,040 | $85,900 | $16,400 | $69,500 |
| 2020 | $1,050 | $85,900 | $16,400 | $69,500 |
| 2019 | $1,041 | $85,900 | $16,400 | $69,500 |
| 2018 | $1,108 | $92,200 | $16,400 | $75,800 |
| 2017 | $1,107 | $92,200 | $0 | $0 |
| 2016 | $551 | $92,200 | $0 | $0 |
| 2015 | $1,125 | $93,500 | $0 | $0 |
| 2014 | $1,125 | $93,500 | $0 | $0 |
Source: Public Records
Map
Nearby Homes
- 13 Warfield Place
- 0 Mckenzie Rd
- 14 Clubhouse Rd
- 1105 Weires Ave
- 73 Lavale Ct
- 0 Winchester Rd Unit MDAL2014062
- 0 Winchester Rd Unit MDAL2012680
- 438 Carr Dr
- 0 0 Sunset Drive Extended #2
- 0 Sunset View Extended
- 1074 Braddock Rd
- 887 Weires Ave
- 678 National Hwy
- 122 Mustaphal Dr
- 1320 National Hwy
- 12303 Mcmullen Hwy SW
- 12401 Mcmullen Hwy SW
- LOT 2 Cherrywood Ave
- 4 Cherrywood Ave
- 11902 Mcmullen Hwy SW
- 1125 Braddock Rd
- 1129 Braddock Rd
- 1123 Braddock Rd
- 1131 Braddock Rd
- 15 Glenview Dr
- 1133 Braddock Rd
- 13 Glenview Dr
- 1121 Braddock Rd
- 1134 Braddock Rd
- 1136 Braddock Rd
- 1135 Braddock Rd
- 11 Glenview Dr
- 1104 Simpson Ave
- 1130 Braddock Rd
- 1138 Braddock Rd
- 1137 Braddock Rd
- 1112 Simpson Ave
- 19 Glenview Terrace
- 1106 Simpson Ave
- 1108 Simpson Ave
Your Personal Tour Guide
Ask me questions while you tour the home.