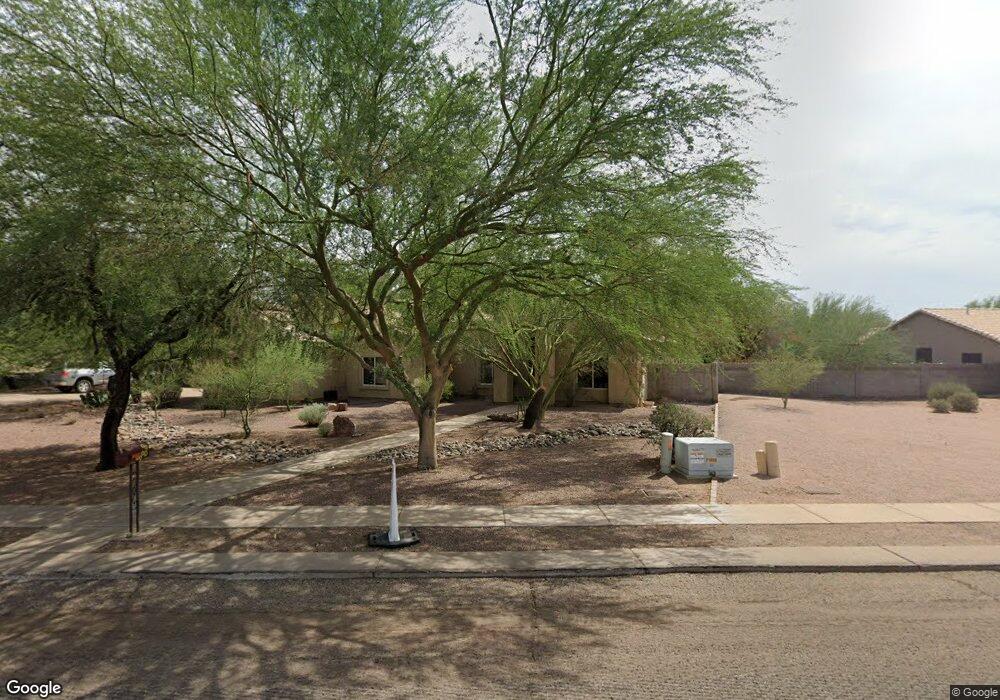
1127 E Kael Cir Mesa, AZ 85203
Lehi NeighborhoodEstimated Value: $662,360 - $902,000
Studio
3
Baths
2,262
Sq Ft
$348/Sq Ft
Est. Value
About This Home
This home is located at 1127 E Kael Cir, Mesa, AZ 85203 and is currently estimated at $788,090, approximately $348 per square foot. 1127 E Kael Cir is a home located in Maricopa County with nearby schools including Lehi Elementary School, Franklin at Brimhall Elementary School, and Franklin West Elementary School.
Ownership History
Date
Name
Owned For
Owner Type
Purchase Details
Closed on
May 10, 2021
Sold by
Schwartzlow John K and Lee Lorene O
Bought by
Schwartzlow John K and Lee Lorene O
Current Estimated Value
Purchase Details
Closed on
Jun 3, 1998
Sold by
Foutz Wanda
Bought by
Schwartzlow John K and Lee Lorene O
Home Financials for this Owner
Home Financials are based on the most recent Mortgage that was taken out on this home.
Original Mortgage
$192,000
Interest Rate
6.9%
Mortgage Type
New Conventional
Purchase Details
Closed on
Sep 11, 1996
Sold by
Burrell Ruben
Bought by
Foutz Wanda
Purchase Details
Closed on
Jun 6, 1996
Sold by
H & J Investments Llc
Bought by
Amberwood Development Inc
Create a Home Valuation Report for This Property
The Home Valuation Report is an in-depth analysis detailing your home's value as well as a comparison with similar homes in the area
Home Values in the Area
Average Home Value in this Area
Purchase History
| Date | Buyer | Sale Price | Title Company |
|---|---|---|---|
| Schwartzlow John K | -- | None Available | |
| Schwartzlow John K | $240,000 | First American Title | |
| Foutz Wanda | -- | Old Republic Title Agency | |
| Foutz Wanda | $194,763 | Old Republic Title Agency | |
| Amberwood Development Inc | $49,900 | Old Republic Title Agency |
Source: Public Records
Mortgage History
| Date | Status | Borrower | Loan Amount |
|---|---|---|---|
| Previous Owner | Schwartzlow John K | $192,000 | |
| Closed | Schwartzlow John K | $24,000 |
Source: Public Records
Tax History
| Year | Tax Paid | Tax Assessment Tax Assessment Total Assessment is a certain percentage of the fair market value that is determined by local assessors to be the total taxable value of land and additions on the property. | Land | Improvement |
|---|---|---|---|---|
| 2025 | $2,927 | $33,865 | -- | -- |
| 2024 | $2,843 | $32,252 | -- | -- |
| 2023 | $2,843 | $49,110 | $9,820 | $39,290 |
| 2022 | $2,781 | $43,470 | $8,690 | $34,780 |
| 2021 | $2,857 | $38,310 | $7,660 | $30,650 |
| 2020 | $2,819 | $36,310 | $7,260 | $29,050 |
| 2019 | $2,611 | $31,480 | $6,290 | $25,190 |
| 2018 | $2,493 | $30,060 | $6,010 | $24,050 |
| 2017 | $2,415 | $28,560 | $5,710 | $22,850 |
| 2016 | $2,371 | $29,780 | $5,950 | $23,830 |
| 2015 | $2,239 | $26,580 | $5,310 | $21,270 |
Source: Public Records
Map
Nearby Homes
- 1203 E Kramer Cir
- 1247 E Kenwood St
- 1920 N Consolidated Canal
- 1836 N Stapley Dr Unit 3
- 1146 E Jensen St
- 1335 E June St Unit 239
- 1335 E June St Unit 113
- 1443 E Leland St
- 2020 N Hunt Cir
- 1044 E Indigo St
- 636 E Knoll St
- 1762 N Barkley
- 1663 N Doran
- 1657 N Doran
- 1924 N Harris Dr
- 630 E Jensen St Unit 148
- 1232 E Mclellan Rd
- 1550 N Stapley Dr Unit 15
- 1550 N Stapley Dr Unit 48
- 1550 N Stapley Dr Unit 134
- 1061 E Knoll St
- 1112 E Kael Cir
- 1053 E Knoll St
- 1132 E Kramer Cir
- 1124 E Kramer Cir
- 1045 E Kael St
- 1146 E Kramer Cir
- 2114 N Stapley Dr
- 1116 E Kramer Cir
- 2106 N Stapley Dr
- 2130 N Stapley Dr
- 1045 E Knoll St
- 1044 E Kramer St
- 1108 E Kramer Cir
- 1040 E Kael St
- 2138 N Stapley Dr
- 1032 E Kramer St
- 1162 E Kramer Cir
- 1137 E Kramer Cir
- 1107 E Lockwood St
Your Personal Tour Guide
Ask me questions while you tour the home.