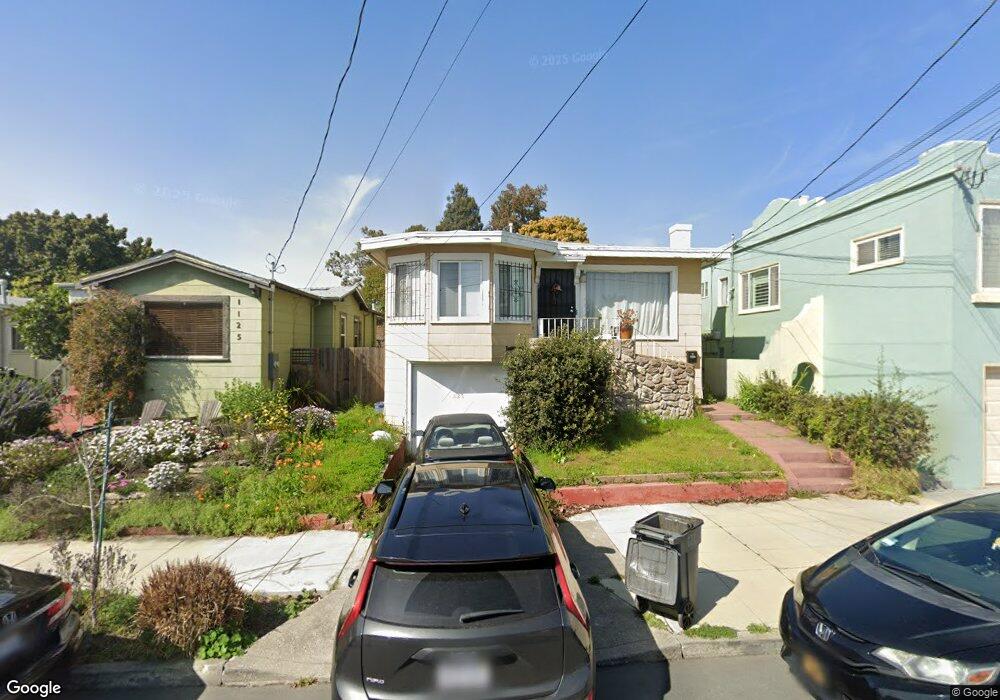
1127 Ward St Berkeley, CA 94702
West Berkeley NeighborhoodEstimated Value: $932,421 - $1,232,000
2
Beds
1
Bath
1,176
Sq Ft
$935/Sq Ft
Est. Value
About This Home
This home is located at 1127 Ward St, Berkeley, CA 94702 and is currently estimated at $1,099,855, approximately $935 per square foot. 1127 Ward St is a home located in Alameda County with nearby schools including Malcolm X Elementary School, Oxford Elementary School, and Washington Elementary School.
Ownership History
Date
Name
Owned For
Owner Type
Purchase Details
Closed on
Jan 27, 2004
Sold by
Jones Esterlee
Bought by
Jones Esterlee and Esterlee Jones Revocable Trust
Current Estimated Value
Purchase Details
Closed on
Oct 9, 2002
Sold by
Jones Ester Lee and Cleveland Jones Revocable Trus
Bought by
Jones Ester Lee
Purchase Details
Closed on
Nov 8, 1995
Sold by
Jones Cleveland
Bought by
Jones Cleveland
Create a Home Valuation Report for This Property
The Home Valuation Report is an in-depth analysis detailing your home's value as well as a comparison with similar homes in the area
Home Values in the Area
Average Home Value in this Area
Purchase History
| Date | Buyer | Sale Price | Title Company |
|---|---|---|---|
| Jones Esterlee | -- | -- | |
| Jones Ester Lee | -- | -- | |
| Jones Cleveland | -- | -- |
Source: Public Records
Tax History
| Year | Tax Paid | Tax Assessment Tax Assessment Total Assessment is a certain percentage of the fair market value that is determined by local assessors to be the total taxable value of land and additions on the property. | Land | Improvement |
|---|---|---|---|---|
| 2025 | $2,716 | $44,485 | $27,704 | $23,781 |
| 2024 | $2,716 | $1,033,400 | $416,160 | $624,240 |
| 2023 | $2,636 | $49,487 | $26,629 | $22,858 |
| 2022 | $2,539 | $41,517 | $26,107 | $22,410 |
| 2021 | $2,510 | $40,566 | $25,595 | $21,971 |
| 2020 | $2,273 | $47,079 | $25,333 | $21,746 |
| 2019 | $2,068 | $46,155 | $24,836 | $21,319 |
| 2018 | $2,003 | $45,250 | $24,349 | $20,901 |
| 2017 | $1,893 | $44,364 | $23,872 | $20,492 |
| 2016 | $1,747 | $43,494 | $23,404 | $20,090 |
| 2015 | $1,711 | $42,840 | $23,052 | $19,788 |
| 2014 | $1,668 | $42,001 | $22,601 | $19,400 |
Source: Public Records
Map
Nearby Homes
- 2751 Wallace St
- 1034 Grayson St
- 2717 Mabel St
- 1010 Grayson St
- 1142 Dwight Way
- 1118 Dwight Way
- 1144 Dwight Way
- 1092 Dwight Way
- 1237 Ashby Ave
- 1450 Ward St
- 2758 Sacramento St
- 2774 Sacramento St
- 2782 Sacramento St
- 2750 Sacramento St
- 2790 Sacramento St
- 1314 Ashby Ave
- 1515 Derby St
- 2922 Stanton St
- 3032 Mabel St
- 1039 Channing Way
Your Personal Tour Guide
Ask me questions while you tour the home.