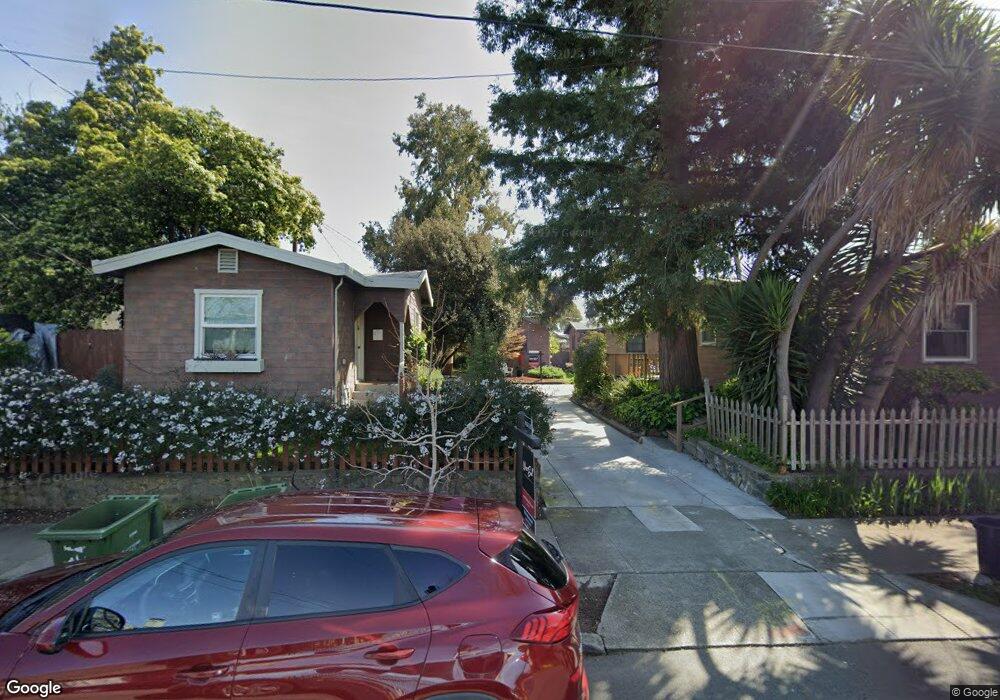
1128 Derby St Unit 2 Berkeley, CA 94702
West Berkeley NeighborhoodEstimated Value: $407,619 - $609,000
1
Bed
1
Bath
488
Sq Ft
$1,051/Sq Ft
Est. Value
About This Home
This home is located at 1128 Derby St Unit 2, Berkeley, CA 94702 and is currently estimated at $512,655, approximately $1,050 per square foot. 1128 Derby St Unit 2 is a home located in Alameda County with nearby schools including Oxford Elementary School, Malcolm X Elementary School, and Washington Elementary School.
Ownership History
Date
Name
Owned For
Owner Type
Purchase Details
Closed on
Jun 14, 2006
Sold by
Small C E
Bought by
Hyman Wendy
Current Estimated Value
Home Financials for this Owner
Home Financials are based on the most recent Mortgage that was taken out on this home.
Original Mortgage
$138,000
Outstanding Balance
$81,405
Interest Rate
6.63%
Mortgage Type
New Conventional
Estimated Equity
$431,250
Create a Home Valuation Report for This Property
The Home Valuation Report is an in-depth analysis detailing your home's value as well as a comparison with similar homes in the area
Home Values in the Area
Average Home Value in this Area
Purchase History
| Date | Buyer | Sale Price | Title Company |
|---|---|---|---|
| Hyman Wendy | $338,000 | Commonwealth Land Title Co |
Source: Public Records
Mortgage History
| Date | Status | Borrower | Loan Amount |
|---|---|---|---|
| Open | Hyman Wendy | $138,000 |
Source: Public Records
Tax History
| Year | Tax Paid | Tax Assessment Tax Assessment Total Assessment is a certain percentage of the fair market value that is determined by local assessors to be the total taxable value of land and additions on the property. | Land | Improvement |
|---|---|---|---|---|
| 2025 | $6,525 | $445,811 | $135,843 | $316,968 |
| 2024 | $6,525 | $436,935 | $133,180 | $310,755 |
| 2023 | $6,391 | $435,231 | $130,569 | $304,662 |
| 2022 | $6,286 | $419,700 | $128,010 | $298,690 |
| 2021 | $6,302 | $411,335 | $125,500 | $292,835 |
| 2020 | $6,010 | $414,045 | $124,213 | $289,832 |
| 2019 | $5,819 | $405,930 | $121,779 | $284,151 |
| 2018 | $5,727 | $397,974 | $119,392 | $278,582 |
| 2017 | $5,512 | $390,173 | $117,052 | $273,121 |
| 2016 | $5,358 | $382,524 | $114,757 | $267,767 |
| 2015 | $5,291 | $376,781 | $113,034 | $263,747 |
| 2014 | $4,798 | $332,000 | $99,600 | $232,400 |
Source: Public Records
Map
Nearby Homes
- 2747 San Pablo Ave Unit 507
- 2751 Wallace St
- 1034 Grayson St
- 1010 Grayson St
- 1142 Dwight Way
- 1118 Dwight Way
- 1092 Dwight Way
- 1237 Ashby Ave
- 1450 Ward St
- 2758 Sacramento St
- 2774 Sacramento St
- 2750 Sacramento St
- 2782 Sacramento St
- 2790 Sacramento St
- 1314 Ashby Ave
- 1039 Channing Way
- 1515 Derby St
- 2922 Stanton St
- 2324 Browning St
- 3032 Mabel St
Your Personal Tour Guide
Ask me questions while you tour the home.