Estimated Value: $615,054 - $676,000
5
Beds
4
Baths
3,671
Sq Ft
$174/Sq Ft
Est. Value
About This Home
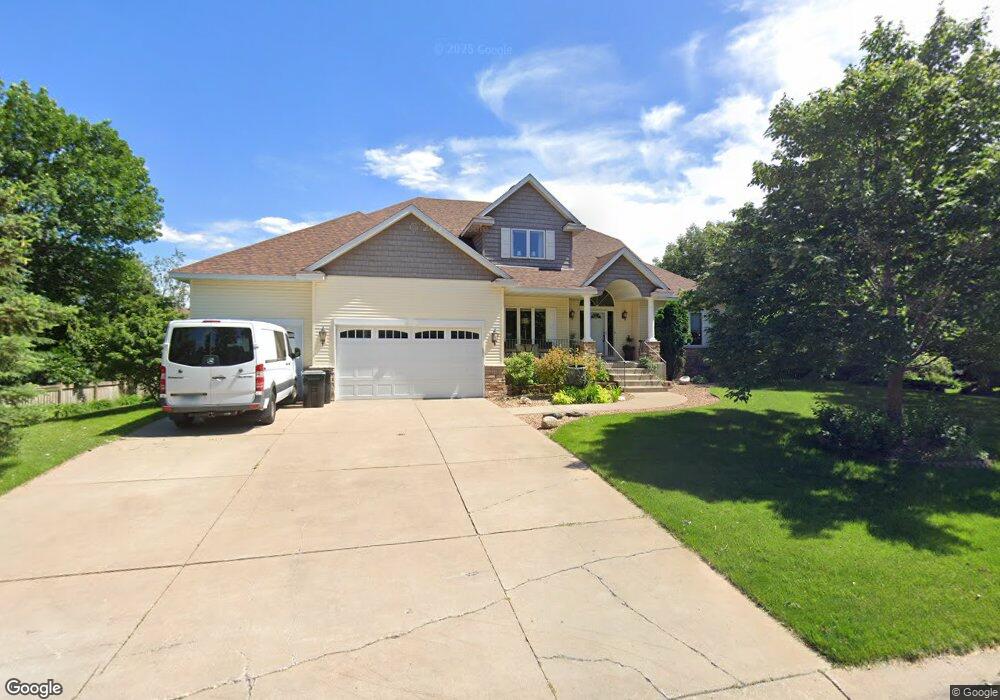
This home is located at 1128 S Trappers Crossing, Hugo, MN 55038 and is currently estimated at $639,014, approximately $174 per square foot. 1128 S Trappers Crossing is a home located in Anoka County with nearby schools including Rice Lake Elementary School, Centennial Middle School, and Centennial High School.
Ownership History
Date
Name
Owned For
Owner Type
Purchase Details
Closed on
Sep 21, 2020
Sold by
Torgerson Richard J
Bought by
Monahan David F and Monahan Shannon
Current Estimated Value
Purchase Details
Closed on
Apr 26, 2004
Sold by
Murphy Mark F and Fessler Heidi J K
Bought by
Torgerson Richard J and Torgerson Leann C
Purchase Details
Closed on
Apr 1, 2003
Sold by
Castlerock Custom Builders Inc
Bought by
Murphy Mark F and Murphy Heidi J K
Purchase Details
Closed on
Jun 8, 2000
Sold by
Hokanson Development Co Inc
Bought by
Castlerock Custom Builders Inc
Create a Home Valuation Report for This Property
The Home Valuation Report is an in-depth analysis detailing your home's value as well as a comparison with similar homes in the area
Home Values in the Area
Average Home Value in this Area
Purchase History
| Date | Buyer | Sale Price | Title Company |
|---|---|---|---|
| Monahan David F | $481,000 | Land Title Inc | |
| Torgerson Richard J | $425,000 | -- | |
| Murphy Mark F | $79,900 | -- | |
| Castle Rock Homes Inc | $58,900 | -- | |
| Castlerock Custom Builders Inc | $58,900 | -- |
Source: Public Records
Mortgage History
| Date | Status | Borrower | Loan Amount |
|---|---|---|---|
| Closed | Castlerock Custom Builders Inc | -- |
Source: Public Records
Tax History Compared to Growth
Tax History
| Year | Tax Paid | Tax Assessment Tax Assessment Total Assessment is a certain percentage of the fair market value that is determined by local assessors to be the total taxable value of land and additions on the property. | Land | Improvement |
|---|---|---|---|---|
| 2025 | $7,197 | $599,800 | $114,000 | $485,800 |
| 2024 | $7,197 | $583,600 | $108,500 | $475,100 |
| 2023 | $6,697 | $590,900 | $117,200 | $473,700 |
| 2022 | $6,774 | $587,700 | $105,600 | $482,100 |
| 2021 | $6,722 | $520,000 | $81,000 | $439,000 |
| 2020 | $6,525 | $504,700 | $90,000 | $414,700 |
| 2019 | $6,505 | $471,900 | $83,100 | $388,800 |
| 2018 | $5,879 | $444,200 | $0 | $0 |
| 2017 | $5,653 | $437,200 | $0 | $0 |
| 2016 | $5,877 | $399,900 | $0 | $0 |
| 2015 | $5,792 | $399,900 | $92,800 | $307,100 |
| 2014 | -- | $362,400 | $91,600 | $270,800 |
Source: Public Records
Map
Nearby Homes
- 1159 Durango Point
- 6484 Killdeer Dr
- 6478 Fox Rd
- 6457 Fox Rd
- 907 Fox Rd
- 78 Rapp Farm Ln
- 8 Leaf Wing Dr
- 66 Monarch Way
- 22 Leaf Wing Dr
- 6445 Pheasant Hills Dr
- 6733 Timberwolf Trail
- 1351 Hunters Ridge
- 6275 W Shadow Lake Dr
- 1428 Sherman Lake Rd
- 1469 Sherman Lake Rd
- 6391 Centerville Rd
- 440 Coyote Trail
- 1610 Widgeon Cir
- 376 Arrowhead Dr
- 1707 Dupre Rd
- 1124 S Trappers Crossing
- 1137 Hudson Trail
- 6360 Cherokee Trail
- 6354 Cherokee Trail
- 1127 S Trappers Crossing
- 6348 Cherokee Trail
- 1149 Hudson Trail
- 1135 S Trappers Crossing
- 6342 Cherokee Trail
- 1120 Hudson Trail
- 1126 Hudson Trail
- 1132 Hudson Trail
- 1123 S Trappers Crossing
- 1139 S Trappers Crossing
- 1138 Hudson Trail
- 6367 Cherokee Trail
- 1144 Hudson Trail
- 6345 Cherokee Trail
- 1150 Hudson Trail
- 6353 Cherokee Trail