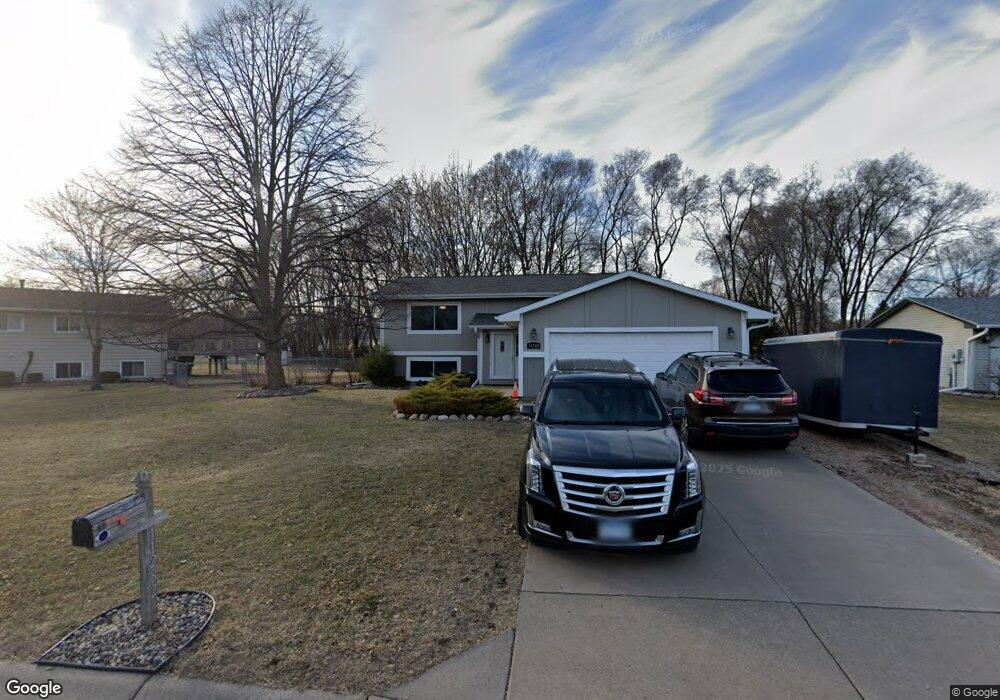
11282 98th Place N Maple Grove, MN 55369
Estimated Value: $353,000 - $391,000
3
Beds
2
Baths
988
Sq Ft
$384/Sq Ft
Est. Value
About This Home
This home is located at 11282 98th Place N, Maple Grove, MN 55369 and is currently estimated at $378,945, approximately $383 per square foot. 11282 98th Place N is a home located in Hennepin County with nearby schools including Elm Creek Elementary School, Osseo Middle School, and Osseo Senior High School.
Ownership History
Date
Name
Owned For
Owner Type
Purchase Details
Closed on
Jan 25, 2016
Sold by
Peggy Peggy
Bought by
Jaydan Seth Seth
Current Estimated Value
Home Financials for this Owner
Home Financials are based on the most recent Mortgage that was taken out on this home.
Original Mortgage
$95,000
Outstanding Balance
$75,386
Interest Rate
3.81%
Estimated Equity
$303,559
Purchase Details
Closed on
Dec 19, 2011
Sold by
Secretary Of Housing & Urban Development
Bought by
Danielson Peggy Jo
Purchase Details
Closed on
Sep 29, 2011
Sold by
Citimortgage Inc
Bought by
Secretary Of Housing & Urban Development
Purchase Details
Closed on
Mar 2, 2011
Sold by
Ohnstad Michael
Bought by
Citimortgage Inc
Purchase Details
Closed on
Jul 28, 2006
Sold by
Lesicka Kristina J
Bought by
Ohnstad Carrie and Ohnstad Michael
Purchase Details
Closed on
Jul 19, 2004
Sold by
Carr Mary Jo
Bought by
Lesicka Kristina J
Create a Home Valuation Report for This Property
The Home Valuation Report is an in-depth analysis detailing your home's value as well as a comparison with similar homes in the area
Home Values in the Area
Average Home Value in this Area
Purchase History
| Date | Buyer | Sale Price | Title Company |
|---|---|---|---|
| Jaydan Seth Seth | $185,000 | -- | |
| Danielson Peggy Jo | -- | Northwest Title Agency Inc | |
| Secretary Of Housing & Urban Development | -- | None Available | |
| Citimortgage Inc | $236,980 | -- | |
| Ohnstad Carrie | $216,000 | -- | |
| Lesicka Kristina J | $205,300 | -- |
Source: Public Records
Mortgage History
| Date | Status | Borrower | Loan Amount |
|---|---|---|---|
| Open | Jaydan Seth Seth | $95,000 |
Source: Public Records
Tax History Compared to Growth
Tax History
| Year | Tax Paid | Tax Assessment Tax Assessment Total Assessment is a certain percentage of the fair market value that is determined by local assessors to be the total taxable value of land and additions on the property. | Land | Improvement |
|---|---|---|---|---|
| 2024 | $4,210 | $357,700 | $125,000 | $232,700 |
| 2023 | $4,259 | $366,500 | $131,600 | $234,900 |
| 2022 | $3,464 | $353,800 | $106,600 | $247,200 |
| 2021 | $3,180 | $294,300 | $80,300 | $214,000 |
| 2020 | $3,159 | $268,300 | $66,300 | $202,000 |
| 2019 | $3,167 | $254,500 | $63,000 | $191,500 |
| 2018 | $2,989 | $242,300 | $62,000 | $180,300 |
| 2017 | $2,812 | $207,100 | $52,000 | $155,100 |
| 2016 | $2,864 | $207,800 | $57,000 | $150,800 |
| 2015 | $2,869 | $203,200 | $59,000 | $144,200 |
| 2014 | -- | $187,700 | $56,500 | $131,200 |
Source: Public Records
Map
Nearby Homes
- 9880 Cottonwood Ln N
- 6866 Zachary Ln N
- 11043 104th Place N
- 9501 Revere Ln N
- 9201 Forestview Ln N
- 9311 Kirkwood Ln N
- 9323 Kirkwood Ln N
- 10000 Nathan Ln N
- 9323 Magnolia Ln N
- 10162 93rd Ave N
- 12795 95th Ave N
- 10781 Boundary Creek Terrace
- 9132 Kirkwood Ln N
- 9058 Goldenrod Ln N
- 9667 103rd Place N
- 9987 106th Place N
- 12599 91st Place N
- 14877 106th Ave N
- 8864 Cottonwood Ln N
- 11760 88th Place N
- 11302 98th Place N
- 11262 98th Place N
- 9931 Balsam Ln N
- 11342 98th Place N
- 11242 98th Place N
- 9911 Balsam Ln N
- 11271 98th Place N
- 9880 Balsam Ln N
- 9951 Balsam Ln N
- 11382 98th Place N
- 9849 Arrowwood Ln N
- 11391 99th Place N
- 11241 98th Place N
- 9881 Balsam Ln N
- 9862 Balsam Ln N
- 11422 98th Place N
- 11221 98th Place N
- 11241 100th Place N
- 9840 Arrowwood Ln N
- 9971 Balsam Ln N