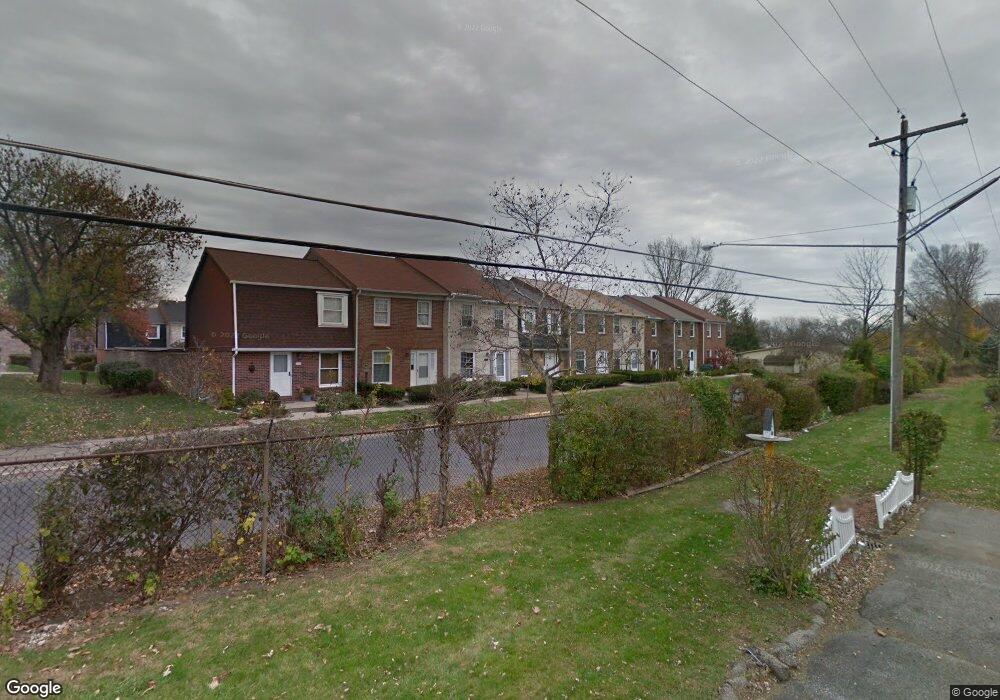
1129 Hardesty Place E Unit P6 Columbus, OH 43204
Brookshire NeighborhoodEstimated Value: $149,000 - $178,000
2
Beds
2
Baths
1,224
Sq Ft
$130/Sq Ft
Est. Value
About This Home
This home is located at 1129 Hardesty Place E Unit P6, Columbus, OH 43204 and is currently estimated at $159,646, approximately $130 per square foot. 1129 Hardesty Place E Unit P6 is a home located in Franklin County with nearby schools including Lindbergh Elementary School, Hilltonia Middle School, and Briggs High School.
Ownership History
Date
Name
Owned For
Owner Type
Purchase Details
Closed on
May 21, 2008
Sold by
Baker Tammy K
Bought by
Goldsmith Robert E and Mccauslin Mark A
Current Estimated Value
Home Financials for this Owner
Home Financials are based on the most recent Mortgage that was taken out on this home.
Original Mortgage
$78,358
Outstanding Balance
$50,166
Interest Rate
6.09%
Mortgage Type
FHA
Estimated Equity
$109,480
Purchase Details
Closed on
Aug 27, 2004
Sold by
Santo Dianna M and Denman Dianna M
Bought by
Baker Tammy K
Home Financials for this Owner
Home Financials are based on the most recent Mortgage that was taken out on this home.
Original Mortgage
$80,800
Interest Rate
6.17%
Mortgage Type
Purchase Money Mortgage
Purchase Details
Closed on
Mar 15, 2001
Sold by
Santo Steven R
Bought by
Santo Dianna M
Purchase Details
Closed on
Aug 23, 1993
Bought by
Denman Dianna M
Create a Home Valuation Report for This Property
The Home Valuation Report is an in-depth analysis detailing your home's value as well as a comparison with similar homes in the area
Home Values in the Area
Average Home Value in this Area
Purchase History
| Date | Buyer | Sale Price | Title Company |
|---|---|---|---|
| Goldsmith Robert E | $79,000 | Title First | |
| Baker Tammy K | $80,800 | Chicago Tit | |
| Santo Dianna M | -- | -- | |
| Denman Dianna M | $56,000 | -- |
Source: Public Records
Mortgage History
| Date | Status | Borrower | Loan Amount |
|---|---|---|---|
| Open | Goldsmith Robert E | $78,358 | |
| Previous Owner | Baker Tammy K | $80,800 |
Source: Public Records
Tax History Compared to Growth
Tax History
| Year | Tax Paid | Tax Assessment Tax Assessment Total Assessment is a certain percentage of the fair market value that is determined by local assessors to be the total taxable value of land and additions on the property. | Land | Improvement |
|---|---|---|---|---|
| 2024 | $2,298 | $51,210 | $8,750 | $42,460 |
| 2023 | $2,269 | $51,205 | $8,750 | $42,455 |
| 2022 | $1,086 | $20,930 | $3,080 | $17,850 |
| 2021 | $1,087 | $20,930 | $3,080 | $17,850 |
| 2020 | $1,089 | $20,930 | $3,080 | $17,850 |
| 2019 | $1,282 | $21,140 | $2,450 | $18,690 |
| 2018 | $1,311 | $21,140 | $2,450 | $18,690 |
| 2017 | $1,282 | $21,140 | $2,450 | $18,690 |
| 2016 | $1,479 | $22,330 | $3,290 | $19,040 |
| 2015 | $1,343 | $22,330 | $3,290 | $19,040 |
| 2014 | $1,346 | $22,330 | $3,290 | $19,040 |
| 2013 | $780 | $26,250 | $3,850 | $22,400 |
Source: Public Records
Map
Nearby Homes
- 2336 Woodbrook Cir N Unit 92 B
- 2362 Woodbrook Cir N Unit 81
- 2362 Woodbrook Cir N Unit F
- 1119 Hardesty Place E Unit 1
- 1085 Hardesty Place E Unit 4
- 1261 Woodbrook Ln Unit C
- 2382 Hardesty Dr S Unit Q-5
- 1226 Woodbrook Cir W Unit D
- 1226 Woodbrook Cir W Unit 144
- 2337 Hardesty Ct Unit 1
- 2430 Hardesty Dr S Unit S7
- 2436 Hardesty Dr S Unit 4
- 2322 Hardesty Ct Unit I11
- 2334 Hardesty Ct Unit 5
- 2354 Hardesty Ct Unit JA6
- 2367 Hardesty Dr N Unit 1-1
- 2375 Hardesty Dr N Unit A5
- 2180 Eakin Rd
- 1033 Whitethorne Ave
- 2547 Rosedale Ave
- 1127 Hardesty Place E
- 1131 Hardesty Place E
- 1125 Hardesty Place E
- 1131 Hardesty Place E Unit 7
- 1133 Hardesty Place E
- 1107 Hardesty Place E
- 1107 Hardesty Place E Unit O-6
- 1135 Hardesty Place E
- 1109 Hardesty Place E Unit O-5
- 1105 Hardesty Place E
- 1123 Hardesty Place E Unit P3
- 1123 Hardesty Place E Unit 3
- 1121 Hardesty Place E
- 1111 Hardesty Place E
- 1103 Hardesty Place E
- 1103 Hardesty Place E Unit O-8
- 1115 Hardesty Place E Unit 2
- 1113 Hardesty Place E
- 1117 Hardesty Place E
- 2378 Hardesty Dr S Unit 7