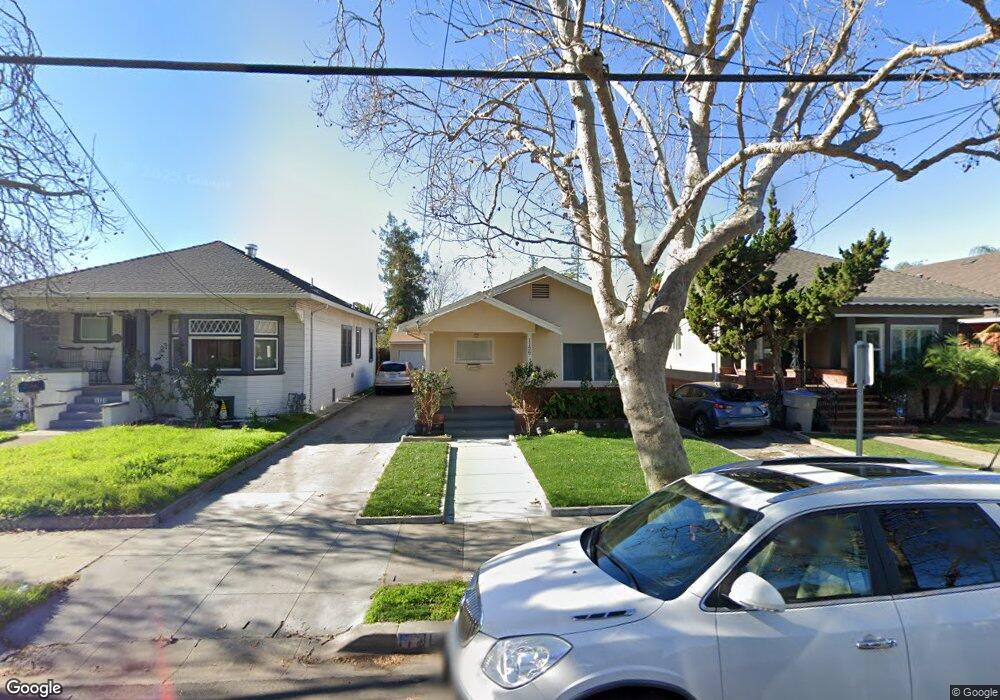
1129 Sherman St San Jose, CA 95110
Tamien NeighborhoodEstimated Value: $792,848 - $972,000
2
Beds
1
Bath
806
Sq Ft
$1,092/Sq Ft
Est. Value
About This Home
This home is located at 1129 Sherman St, San Jose, CA 95110 and is currently estimated at $880,212, approximately $1,092 per square foot. 1129 Sherman St is a home located in Santa Clara County with nearby schools including Washington Elementary School, Willow Glen Middle, and Willow Glen High School.
Ownership History
Date
Name
Owned For
Owner Type
Purchase Details
Closed on
Aug 9, 2007
Sold by
Quinones Juan and Quinones Josefina
Bought by
Quinones Juan and Quinones Josefina
Current Estimated Value
Home Financials for this Owner
Home Financials are based on the most recent Mortgage that was taken out on this home.
Original Mortgage
$144,000
Outstanding Balance
$90,987
Interest Rate
6.62%
Mortgage Type
New Conventional
Estimated Equity
$789,225
Purchase Details
Closed on
Feb 3, 1998
Sold by
Juan Quinonez and Garate Jose
Bought by
Quinonez Juan and Quinonez Josefina
Home Financials for this Owner
Home Financials are based on the most recent Mortgage that was taken out on this home.
Original Mortgage
$135,000
Interest Rate
6.98%
Purchase Details
Closed on
Dec 6, 1994
Sold by
Garate Graciela
Bought by
Garate Jose
Home Financials for this Owner
Home Financials are based on the most recent Mortgage that was taken out on this home.
Original Mortgage
$133,200
Interest Rate
9.1%
Purchase Details
Closed on
Dec 1, 1994
Sold by
Prentice Elizabeth
Bought by
Quinonez Juan and Quinonez Josefina
Home Financials for this Owner
Home Financials are based on the most recent Mortgage that was taken out on this home.
Original Mortgage
$133,200
Interest Rate
9.1%
Create a Home Valuation Report for This Property
The Home Valuation Report is an in-depth analysis detailing your home's value as well as a comparison with similar homes in the area
Home Values in the Area
Average Home Value in this Area
Purchase History
| Date | Buyer | Sale Price | Title Company |
|---|---|---|---|
| Quinones Juan | -- | Chicago Title Company | |
| Quinonez Juan | $13,500 | All Cal Title Company | |
| Garate Jose | -- | North American Title Co Inc | |
| Quinonez Juan | $148,000 | North American Title Co Inc |
Source: Public Records
Mortgage History
| Date | Status | Borrower | Loan Amount |
|---|---|---|---|
| Open | Quinones Juan | $144,000 | |
| Closed | Quinonez Juan | $135,000 | |
| Closed | Quinonez Juan | $133,200 |
Source: Public Records
Tax History Compared to Growth
Tax History
| Year | Tax Paid | Tax Assessment Tax Assessment Total Assessment is a certain percentage of the fair market value that is determined by local assessors to be the total taxable value of land and additions on the property. | Land | Improvement |
|---|---|---|---|---|
| 2025 | $4,304 | $248,563 | $167,955 | $80,608 |
| 2024 | $4,304 | $243,690 | $164,662 | $79,028 |
| 2023 | $4,186 | $238,913 | $161,434 | $77,479 |
| 2022 | $4,149 | $234,229 | $158,269 | $75,960 |
| 2021 | $4,014 | $229,637 | $155,166 | $74,471 |
| 2020 | $3,883 | $227,283 | $153,575 | $73,708 |
| 2019 | $3,778 | $222,827 | $150,564 | $72,263 |
| 2018 | $3,720 | $218,459 | $147,612 | $70,847 |
| 2017 | $3,676 | $214,176 | $144,718 | $69,458 |
| 2016 | $3,531 | $209,978 | $141,881 | $68,097 |
| 2015 | $3,493 | $206,825 | $139,750 | $67,075 |
| 2014 | $3,071 | $202,775 | $137,013 | $65,762 |
Source: Public Records
Map
Nearby Homes
- 1210 Mastic St
- 82 Hollywood Ave
- 114 Hollywood Ave
- 1060 S 3rd St Unit 379
- 1060 S 3rd St Unit 179
- 1060 S 3rd St Unit 233
- 1060 S 3rd St Unit 216
- 1060 S 3rd St Unit 129
- 1060 S 3rd St Unit 344
- 198 Floyd St
- 1144 Locust St
- 85 Oak St
- 896 S Almaden Ave
- 1148 Palm St
- 1493 Sanborn Ave
- 1497 Sanborn Ave
- 1488 Pomona Ave
- 1376 Palm St
- 118 Cottage Grove Ave
- 316 Stonegate Cir
- 1131 Sherman St
- 1145 Sherman St
- 1121 Sherman St
- 1157 Sherman St
- 74 Goodyear St
- 1111 Sherman St
- 1161 Sherman St
- 78 Goodyear St
- 1101 Sherman St
- 1128 Mastic St
- 1136 Mastic St
- 82 Goodyear St
- 1144 Mastic St
- 1169 Sherman St
- 1152 Mastic St
- 48 Goodyear St
- 90 Goodyear St
- 1122 Sherman St
- 1173 Sherman St
- 1160 Mastic St