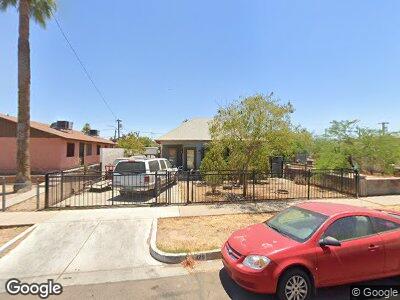
1129 W Fillmore St Phoenix, AZ 85007
Governmental Mall NeighborhoodEstimated Value: $382,000 - $484,000
--
Bed
2
Baths
1,578
Sq Ft
$274/Sq Ft
Est. Value
About This Home
This home is located at 1129 W Fillmore St, Phoenix, AZ 85007 and is currently estimated at $432,333, approximately $273 per square foot. 1129 W Fillmore St is a home located in Maricopa County with nearby schools including Kenilworth Elementary School, Phoenix Coding Academy, and Central High School.
Ownership History
Date
Name
Owned For
Owner Type
Purchase Details
Closed on
Mar 2, 2001
Sold by
Seat Of Our Pants Inc and Dodt Michael
Bought by
Valenzuela Oscar
Current Estimated Value
Purchase Details
Closed on
Jan 24, 2001
Sold by
Santillanes Adriana
Bought by
Valenzuela Oscar A
Purchase Details
Closed on
Nov 2, 2000
Sold by
Dodt Nancy
Bought by
Dodt Michael
Purchase Details
Closed on
Oct 27, 2000
Sold by
Garcia Teresa
Bought by
Seat Of Our Pants Inc and Dodt Michael
Purchase Details
Closed on
Apr 27, 2000
Sold by
Garcia Teresa
Bought by
Nationscredit Financial Services Corp
Purchase Details
Closed on
Mar 4, 1998
Sold by
Garcia Arturo S
Bought by
Garcia Teresa
Home Financials for this Owner
Home Financials are based on the most recent Mortgage that was taken out on this home.
Original Mortgage
$18,856
Interest Rate
7.11%
Create a Home Valuation Report for This Property
The Home Valuation Report is an in-depth analysis detailing your home's value as well as a comparison with similar homes in the area
Home Values in the Area
Average Home Value in this Area
Purchase History
| Date | Buyer | Sale Price | Title Company |
|---|---|---|---|
| Valenzuela Oscar | $77,000 | Nations Title Insurance | |
| Valenzuela Oscar A | -- | Lawyers Title Of Arizona Inc | |
| Dodt Michael | -- | Century Title Agency Inc | |
| Seat Of Our Pants Inc | -- | Century Title Agency Inc | |
| Nationscredit Financial Services Corp | $20,095 | Fidelity National Title | |
| Garcia Teresa | -- | Transnation Title Insurance |
Source: Public Records
Mortgage History
| Date | Status | Borrower | Loan Amount |
|---|---|---|---|
| Open | Valenzuela Oscar | $60,800 | |
| Closed | Valenzuela Oscar | $10,000 | |
| Previous Owner | Garcia Teresa | $18,856 |
Source: Public Records
Tax History Compared to Growth
Tax History
| Year | Tax Paid | Tax Assessment Tax Assessment Total Assessment is a certain percentage of the fair market value that is determined by local assessors to be the total taxable value of land and additions on the property. | Land | Improvement |
|---|---|---|---|---|
| 2025 | $1,439 | $12,138 | -- | -- |
| 2024 | $1,425 | $11,560 | -- | -- |
| 2023 | $1,425 | $29,070 | $5,810 | $23,260 |
| 2022 | $1,371 | $19,480 | $3,890 | $15,590 |
| 2021 | $1,372 | $16,120 | $3,220 | $12,900 |
| 2020 | $1,392 | $13,030 | $2,600 | $10,430 |
| 2019 | $1,392 | $12,580 | $2,510 | $10,070 |
| 2018 | $412 | $5,670 | $1,130 | $4,540 |
| 2017 | $398 | $5,170 | $1,030 | $4,140 |
| 2016 | $386 | $4,750 | $950 | $3,800 |
| 2015 | $352 | $4,260 | $850 | $3,410 |
Source: Public Records
Map
Nearby Homes
- 1130 W Fillmore St
- 1046 W Taylor St
- 1046 W Polk St
- 1050 W Polk St Unit 1 & 2
- 535 N 15th Ave
- 1505 W Fillmore St
- 1505 W Pierce St
- 809 N 11th Ave
- 1509 W Pierce St
- 1522 W Fillmore St
- 1522 W Fillmore St Unit 6-7
- 1527 W Fillmore St
- 1521 W Mckinley St Unit 19
- 1521 W Mckinley St Unit 18
- 1521 W Garfield St
- 1546 W Pierce St
- 136 N 11th Ave
- 311 N Laurel Ave
- 820 N 8th Ave Unit 25
- 777 W Roosevelt St Unit 2
- 1129 W Fillmore St
- 1131 W Fillmore St
- 1123 W Fillmore St
- 1133 W Fillmore St
- 1119 W Fillmore St
- 1135 W Fillmore St
- 1115 W Fillmore St
- 1139 W Fillmore St
- 1058 W Taylor St
- 1056 W Taylor St
- 1048 W Taylor St
- 1060 W Taylor St
- 1143 W Fillmore St
- 1042 W Taylor St
- 1134 W Fillmore St
- 505 N 13th Ave
- 503 N 13th Ave
- 1145 W Fillmore St
- 1038 W Taylor St
- 1140 W Fillmore St