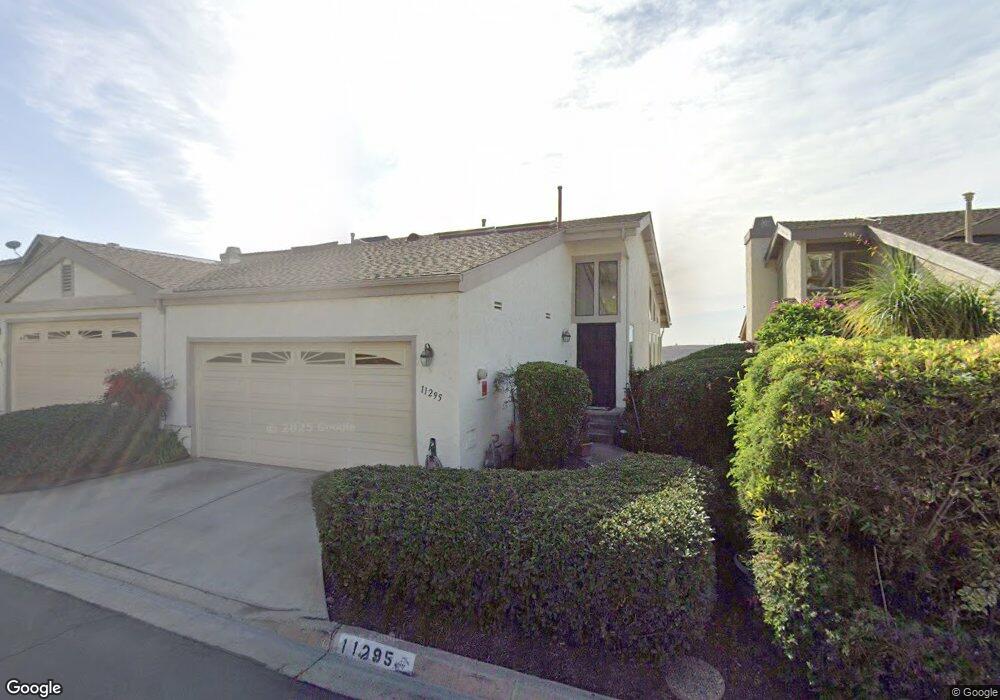
11295 Cascada Way San Diego, CA 92124
Tierrasanta NeighborhoodEstimated Value: $704,000 - $838,000
2
Beds
3
Baths
1,398
Sq Ft
$536/Sq Ft
Est. Value
About This Home
This home is located at 11295 Cascada Way, San Diego, CA 92124 and is currently estimated at $749,873, approximately $536 per square foot. 11295 Cascada Way is a home located in San Diego County with nearby schools including Tierrasanta Elementary, Farb Middle School, and De Portola Middle School.
Ownership History
Date
Name
Owned For
Owner Type
Purchase Details
Closed on
Dec 28, 2017
Sold by
Kean Craig M and Carmean Jennifer
Bought by
Kean Craig M and Carmean Jennifer
Current Estimated Value
Purchase Details
Closed on
May 26, 1998
Sold by
Regitz William M and Karp Melissa B
Bought by
Kean Craig M and Carmean Jennifer
Home Financials for this Owner
Home Financials are based on the most recent Mortgage that was taken out on this home.
Original Mortgage
$155,400
Outstanding Balance
$31,305
Interest Rate
7.13%
Estimated Equity
$718,568
Purchase Details
Closed on
Dec 30, 1988
Purchase Details
Closed on
Feb 23, 1987
Purchase Details
Closed on
Sep 24, 1984
Create a Home Valuation Report for This Property
The Home Valuation Report is an in-depth analysis detailing your home's value as well as a comparison with similar homes in the area
Home Values in the Area
Average Home Value in this Area
Purchase History
| Date | Buyer | Sale Price | Title Company |
|---|---|---|---|
| Kean Craig M | -- | None Available | |
| Kean Craig M | $160,500 | American Title Co | |
| -- | $170,000 | -- | |
| -- | $139,000 | -- | |
| -- | $119,200 | -- |
Source: Public Records
Mortgage History
| Date | Status | Borrower | Loan Amount |
|---|---|---|---|
| Open | Kean Craig M | $155,400 |
Source: Public Records
Tax History Compared to Growth
Tax History
| Year | Tax Paid | Tax Assessment Tax Assessment Total Assessment is a certain percentage of the fair market value that is determined by local assessors to be the total taxable value of land and additions on the property. | Land | Improvement |
|---|---|---|---|---|
| 2025 | $3,127 | $255,855 | $160,919 | $94,936 |
| 2024 | $3,127 | $250,839 | $157,764 | $93,075 |
| 2023 | $3,054 | $245,921 | $154,671 | $91,250 |
| 2022 | $2,967 | $241,100 | $151,639 | $89,461 |
| 2021 | $2,941 | $236,373 | $148,666 | $87,707 |
| 2020 | $2,904 | $233,950 | $147,142 | $86,808 |
| 2019 | $2,851 | $229,363 | $144,257 | $85,106 |
| 2018 | $2,667 | $224,867 | $141,429 | $83,438 |
| 2017 | $80 | $220,458 | $138,656 | $81,802 |
| 2016 | $2,559 | $216,137 | $135,938 | $80,199 |
| 2015 | $2,519 | $212,892 | $133,897 | $78,995 |
| 2014 | $2,479 | $208,723 | $131,275 | $77,448 |
Source: Public Records
Map
Nearby Homes
- 11283 Cascada Way
- 11464 Azucena Dr
- 11233 Tierrasanta Blvd Unit 30
- 11655 Cebada Ct
- 7890 Mission Vista Dr
- 4999 Paguera Ct
- 3631 Mission Mesa Way
- 5214 Lewison Place
- 4808 1/2 Old Cliffs Rd
- 4778 1/2 Old Cliffs Rd
- 4959 Old Cliffs Rd
- 4812 Old Cliffs Rd
- 4944 Old Cliffs Rd
- 4938 Old Cliffs Rd
- 5125 Fontaine St Unit 105
- 10852 Carbet Place
- 5059 La Cuenta Dr
- 7740 Margerum Ave Unit 204
- 10829 Macouba Place
- 10862 Caravelle Place
- 11299 Cascada Way
- 11289 Cascada Way
- 11311 Cascada Way
- 11315 Cascada Way
- 11279 Cascada Way
- 11323 Cascada Way
- 11275 Cascada Way
- 11329 Cascada Way
- 11439 Madera Rosa Way
- 11437 Madera Rosa Way
- 11435 Madera Rosa Way
- 11443 Madera Rosa Way
- 11335 Cascada Way
- 11445 Madera Rosa Way
- 11433 Madera Rosa Way
- 11429 Madera Rosa Way
- 11449 Madera Rosa Way
- 11269 Cascada Way
- 11339 Cascada Way
- 11427 Madera Rosa Way