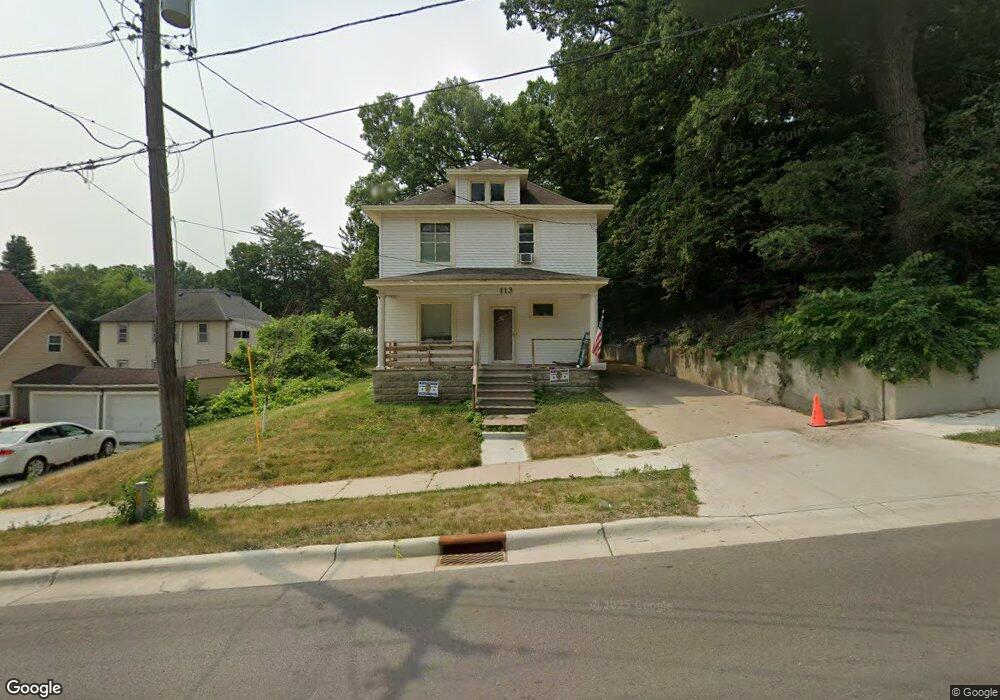
113 113 Division-Street-w Faribault, MN 55021
Estimated Value: $217,000 - $263,000
3
Beds
2
Baths
1,504
Sq Ft
$166/Sq Ft
Est. Value
About This Home
This home is located at 113 113 Division-Street-w, Faribault, MN 55021 and is currently estimated at $249,697, approximately $166 per square foot. 113 113 Division-Street-w is a home located in Rice County with nearby schools including Roosevelt Elementary School, Faribault Middle School, and Faribault Senior High School.
Ownership History
Date
Name
Owned For
Owner Type
Purchase Details
Closed on
Aug 26, 2016
Sold by
Lin Shuang and Guo Xue Jin
Bought by
Struffert Jeremy
Current Estimated Value
Home Financials for this Owner
Home Financials are based on the most recent Mortgage that was taken out on this home.
Original Mortgage
$107,969
Interest Rate
4.13%
Mortgage Type
New Conventional
Purchase Details
Closed on
Sep 30, 2008
Sold by
Beneficial Loan & Thrift Co
Bought by
Shuang Lin
Purchase Details
Closed on
May 31, 2001
Sold by
Walker Kirk S and Fuller Michael C
Bought by
Herrin James D and Neil Dani M
Purchase Details
Closed on
Apr 20, 2000
Sold by
Gillen Lisa Kay and Gillen Christopher A
Bought by
Walker Kirk S and Fuller Michael C
Create a Home Valuation Report for This Property
The Home Valuation Report is an in-depth analysis detailing your home's value as well as a comparison with similar homes in the area
Home Values in the Area
Average Home Value in this Area
Purchase History
| Date | Buyer | Sale Price | Title Company |
|---|---|---|---|
| Struffert Jeremy | $105,000 | North Title | |
| Shuang Lin | $56,000 | -- | |
| Herrin James D | $114,750 | -- | |
| Walker Kirk S | $82,000 | -- |
Source: Public Records
Mortgage History
| Date | Status | Borrower | Loan Amount |
|---|---|---|---|
| Previous Owner | Struffert Jeremy | $107,969 |
Source: Public Records
Tax History Compared to Growth
Tax History
| Year | Tax Paid | Tax Assessment Tax Assessment Total Assessment is a certain percentage of the fair market value that is determined by local assessors to be the total taxable value of land and additions on the property. | Land | Improvement |
|---|---|---|---|---|
| 2025 | $2,400 | $228,600 | $52,600 | $176,000 |
| 2024 | $2,400 | $210,400 | $49,400 | $161,000 |
| 2023 | $2,256 | $210,400 | $49,400 | $161,000 |
| 2022 | $2,022 | $199,700 | $49,400 | $150,300 |
| 2021 | $1,964 | $171,600 | $39,800 | $131,800 |
| 2020 | $1,860 | $166,900 | $38,200 | $128,700 |
| 2019 | $1,696 | $161,900 | $38,200 | $123,700 |
| 2018 | $1,544 | $148,500 | $35,000 | $113,500 |
| 2017 | $1,230 | $134,900 | $31,900 | $103,000 |
| 2016 | $1,502 | $110,400 | $31,900 | $78,500 |
| 2015 | $1,384 | $104,100 | $25,500 | $78,600 |
| 2014 | -- | $100,500 | $25,500 | $75,000 |
Source: Public Records
Map
Nearby Homes