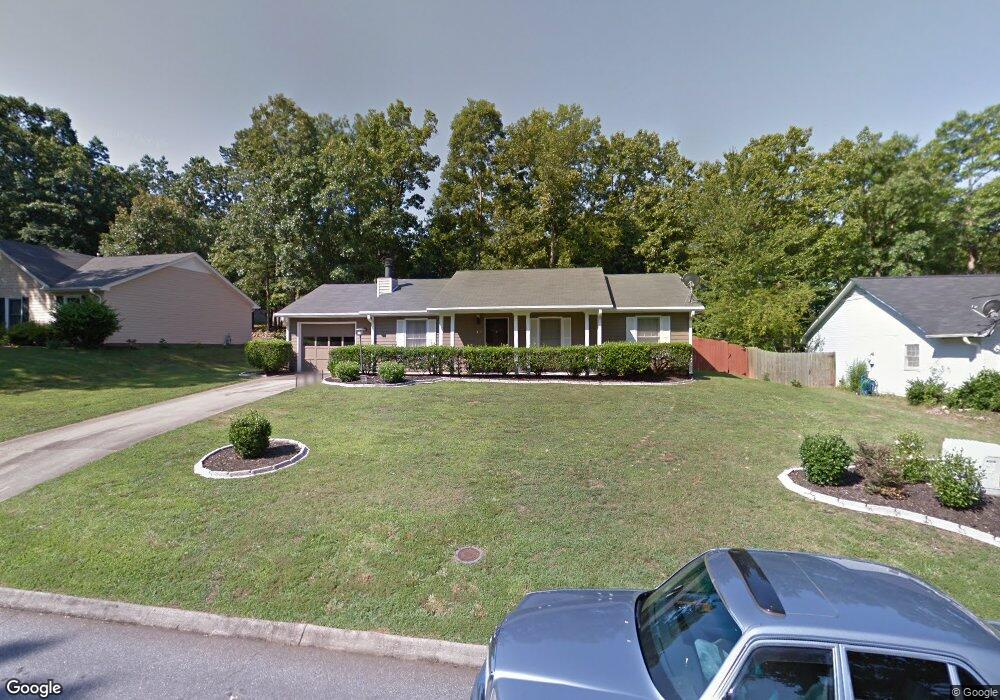
113 Belford Rd Mauldin, SC 29662
Estimated Value: $229,000 - $281,000
3
Beds
2
Baths
1,260
Sq Ft
$203/Sq Ft
Est. Value
About This Home
This home is located at 113 Belford Rd, Mauldin, SC 29662 and is currently estimated at $255,389, approximately $202 per square foot. 113 Belford Rd is a home located in Greenville County with nearby schools including Bethel Elementary School, Mauldin Middle School, and Mauldin High School.
Ownership History
Date
Name
Owned For
Owner Type
Purchase Details
Closed on
Sep 17, 2015
Sold by
Caston Bobby R and Duncan Alice
Bought by
Caston Bobby R and Caston Alice D
Current Estimated Value
Home Financials for this Owner
Home Financials are based on the most recent Mortgage that was taken out on this home.
Original Mortgage
$195,000
Interest Rate
3.35%
Mortgage Type
Reverse Mortgage Home Equity Conversion Mortgage
Purchase Details
Closed on
Nov 6, 2003
Sold by
Caston Bobby
Bought by
Caston Bobby R
Create a Home Valuation Report for This Property
The Home Valuation Report is an in-depth analysis detailing your home's value as well as a comparison with similar homes in the area
Home Values in the Area
Average Home Value in this Area
Purchase History
| Date | Buyer | Sale Price | Title Company |
|---|---|---|---|
| Caston Bobby R | -- | -- | |
| Caston Bobby R | -- | -- |
Source: Public Records
Mortgage History
| Date | Status | Borrower | Loan Amount |
|---|---|---|---|
| Closed | Caston Bobby R | $195,000 |
Source: Public Records
Tax History Compared to Growth
Tax History
| Year | Tax Paid | Tax Assessment Tax Assessment Total Assessment is a certain percentage of the fair market value that is determined by local assessors to be the total taxable value of land and additions on the property. | Land | Improvement |
|---|---|---|---|---|
| 2024 | $571 | $5,190 | $850 | $4,340 |
| 2023 | $571 | $5,190 | $850 | $4,340 |
| 2022 | $538 | $5,190 | $850 | $4,340 |
| 2021 | $538 | $5,190 | $850 | $4,340 |
| 2020 | $457 | $4,510 | $740 | $3,770 |
| 2019 | $457 | $4,510 | $740 | $3,770 |
| 2018 | $456 | $4,510 | $740 | $3,770 |
| 2017 | $456 | $4,510 | $740 | $3,770 |
| 2016 | $430 | $112,780 | $18,500 | $94,280 |
| 2015 | $798 | $112,780 | $18,500 | $94,280 |
| 2014 | $813 | $115,860 | $18,500 | $97,360 |
Source: Public Records
Map
Nearby Homes