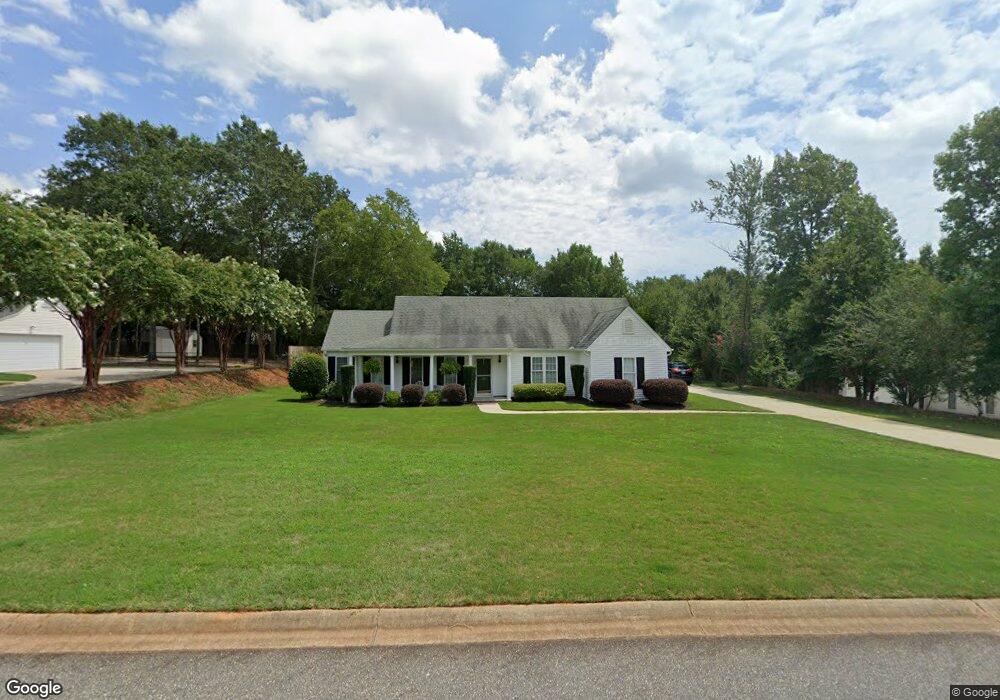
113 Carrie Leigh Ln Pendleton, SC 29670
Estimated Value: $273,325 - $314,000
3
Beds
2
Baths
1,700
Sq Ft
$172/Sq Ft
Est. Value
About This Home
This home is located at 113 Carrie Leigh Ln, Pendleton, SC 29670 and is currently estimated at $292,831, approximately $172 per square foot. 113 Carrie Leigh Ln is a home located in Anderson County with nearby schools including Pendleton High School and Clemson Montessori School.
Ownership History
Date
Name
Owned For
Owner Type
Purchase Details
Closed on
Jul 16, 2025
Sold by
Lowe Billy
Bought by
Lowe Billy and Lowe Geraldine
Current Estimated Value
Purchase Details
Closed on
Oct 7, 2010
Sold by
Armstrong Nancy J
Bought by
Lowe Billy
Home Financials for this Owner
Home Financials are based on the most recent Mortgage that was taken out on this home.
Original Mortgage
$150,259
Interest Rate
4.36%
Mortgage Type
New Conventional
Purchase Details
Closed on
Apr 18, 2008
Sold by
Armstrong Ashley M
Bought by
Armstrong Nancy J
Home Financials for this Owner
Home Financials are based on the most recent Mortgage that was taken out on this home.
Original Mortgage
$51,000
Interest Rate
6.08%
Mortgage Type
New Conventional
Purchase Details
Closed on
Jan 10, 2006
Sold by
M E L Llc
Bought by
Armstrong Nancy J and Armstrong Ashley M
Home Financials for this Owner
Home Financials are based on the most recent Mortgage that was taken out on this home.
Original Mortgage
$35,000
Interest Rate
6.21%
Mortgage Type
Construction
Create a Home Valuation Report for This Property
The Home Valuation Report is an in-depth analysis detailing your home's value as well as a comparison with similar homes in the area
Home Values in the Area
Average Home Value in this Area
Purchase History
| Date | Buyer | Sale Price | Title Company |
|---|---|---|---|
| Lowe Billy | -- | None Listed On Document | |
| Lowe Billy | $145,000 | -- | |
| Armstrong Nancy J | -- | -- | |
| Armstrong Nancy J | $19,000 | None Available |
Source: Public Records
Mortgage History
| Date | Status | Borrower | Loan Amount |
|---|---|---|---|
| Previous Owner | Lowe Billy | $150,259 | |
| Previous Owner | Armstrong Nancy J | $51,000 | |
| Previous Owner | Armstrong Nancy J | $35,000 |
Source: Public Records
Tax History
| Year | Tax Paid | Tax Assessment Tax Assessment Total Assessment is a certain percentage of the fair market value that is determined by local assessors to be the total taxable value of land and additions on the property. | Land | Improvement |
|---|---|---|---|---|
| 2024 | $741 | $7,890 | $1,560 | $6,330 |
| 2023 | $1,104 | $7,890 | $1,560 | $6,330 |
| 2022 | $966 | $7,890 | $1,560 | $6,330 |
| 2021 | $844 | $5,780 | $660 | $5,120 |
| 2020 | $831 | $5,780 | $660 | $5,120 |
| 2019 | $831 | $5,780 | $660 | $5,120 |
| 2018 | $837 | $5,780 | $660 | $5,120 |
| 2017 | -- | $5,780 | $660 | $5,120 |
| 2016 | $812 | $5,570 | $720 | $4,850 |
| 2015 | $817 | $5,570 | $720 | $4,850 |
| 2014 | $838 | $5,570 | $720 | $4,850 |
Source: Public Records
Map
Nearby Homes
- 104 Carrie Leigh Ln
- 28 Vanessa Rae Ln
- 110 Wyndham Dr
- 427 Bee Cove Way
- 455 Bee Cove Way
- 107 Colonial Ct
- 209 Grassy Creek Way
- 540 Seaborn Cir
- 538 Seaborn Cir
- 103 Windward Ct
- 0 Cherry Street Extension
- 102 Magnolia Ln
- 559 Brasstown Ct
- 516 Brasstown Ct
- 515 Brasstown Ct
- 616 Anderson Rd
- 176 Crooked Cedar Way
- 100 Antique Ct
- 110 Cotesworth St
- 138 Cotesworth St
- 111 Carrie Leigh Ln
- 115 Carrie Leigh Ln
- 125 Jasmine Ln
- 123 Jasmine Ln
- 127 Jasmine Ln
- 117 Carrie Leigh Ln
- 109 Carrie Leigh Ln
- 106 Carrie Leigh Ln
- 110 Carrie Leigh Ln
- 121 Jasmine Ln
- 129 Jasmine Ln
- 119 Carrie Leigh Ln
- 107 Carrie Leigh Ln
- 5 Vanessa Rae Ln
- 112 Carrie Leigh Ln
- 3 Vanessa Rae Ln
- 7 Vanessa Rae Ln
- 116 Jasmine Ln
- 116 Jasmine Ln Unit Pendleton
- 119 Jasmine Ln
Your Personal Tour Guide
Ask me questions while you tour the home.