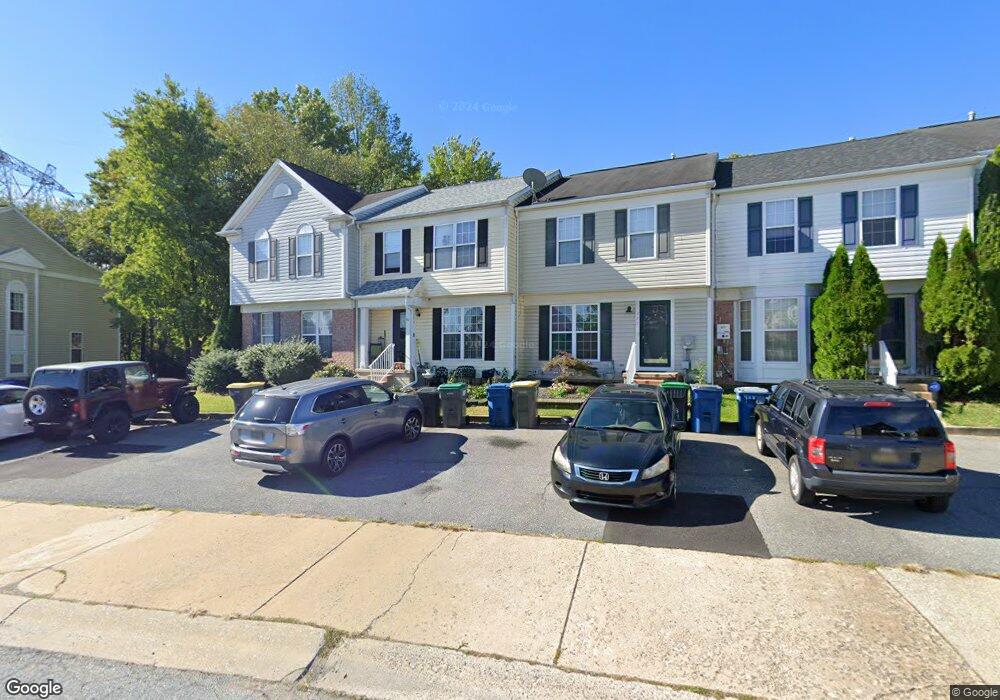
113 Darling St Newark, DE 19702
Estimated Value: $312,000 - $344,364
3
Beds
3
Baths
1,342
Sq Ft
$247/Sq Ft
Est. Value
About This Home
This home is located at 113 Darling St, Newark, DE 19702 and is currently estimated at $332,091, approximately $247 per square foot. 113 Darling St is a home located in New Castle County with nearby schools including Marshall (Thurgood) Elementary School, Christiana High School, and Kirk (George V.) Middle School.
Ownership History
Date
Name
Owned For
Owner Type
Purchase Details
Closed on
Oct 31, 2001
Sold by
Pulte Home Corp
Bought by
Spencer Denise M
Current Estimated Value
Home Financials for this Owner
Home Financials are based on the most recent Mortgage that was taken out on this home.
Original Mortgage
$148,088
Outstanding Balance
$57,795
Interest Rate
6.7%
Mortgage Type
FHA
Estimated Equity
$274,296
Purchase Details
Closed on
Dec 21, 2000
Sold by
River Walk Inc
Bought by
Pulte Home Corp
Create a Home Valuation Report for This Property
The Home Valuation Report is an in-depth analysis detailing your home's value as well as a comparison with similar homes in the area
Home Values in the Area
Average Home Value in this Area
Purchase History
| Date | Buyer | Sale Price | Title Company |
|---|---|---|---|
| Spencer Denise M | $150,415 | -- | |
| Pulte Home Corp | $297,000 | -- |
Source: Public Records
Mortgage History
| Date | Status | Borrower | Loan Amount |
|---|---|---|---|
| Open | Spencer Denise M | $148,088 | |
| Closed | Spencer Denise M | $5,000 |
Source: Public Records
Tax History Compared to Growth
Tax History
| Year | Tax Paid | Tax Assessment Tax Assessment Total Assessment is a certain percentage of the fair market value that is determined by local assessors to be the total taxable value of land and additions on the property. | Land | Improvement |
|---|---|---|---|---|
| 2024 | $2,022 | $57,400 | $8,100 | $49,300 |
| 2023 | $1,956 | $57,400 | $8,100 | $49,300 |
| 2022 | $1,939 | $57,400 | $8,100 | $49,300 |
| 2021 | $2,387 | $57,400 | $8,100 | $49,300 |
| 2020 | $2,322 | $57,400 | $8,100 | $49,300 |
| 2019 | $2,510 | $57,400 | $8,100 | $49,300 |
| 2018 | $2,013 | $57,400 | $8,100 | $49,300 |
| 2017 | $1,944 | $57,400 | $8,100 | $49,300 |
| 2016 | $1,929 | $57,400 | $8,100 | $49,300 |
| 2015 | $1,763 | $57,400 | $8,100 | $49,300 |
| 2014 | $1,765 | $57,400 | $8,100 | $49,300 |
Source: Public Records
Map
Nearby Homes