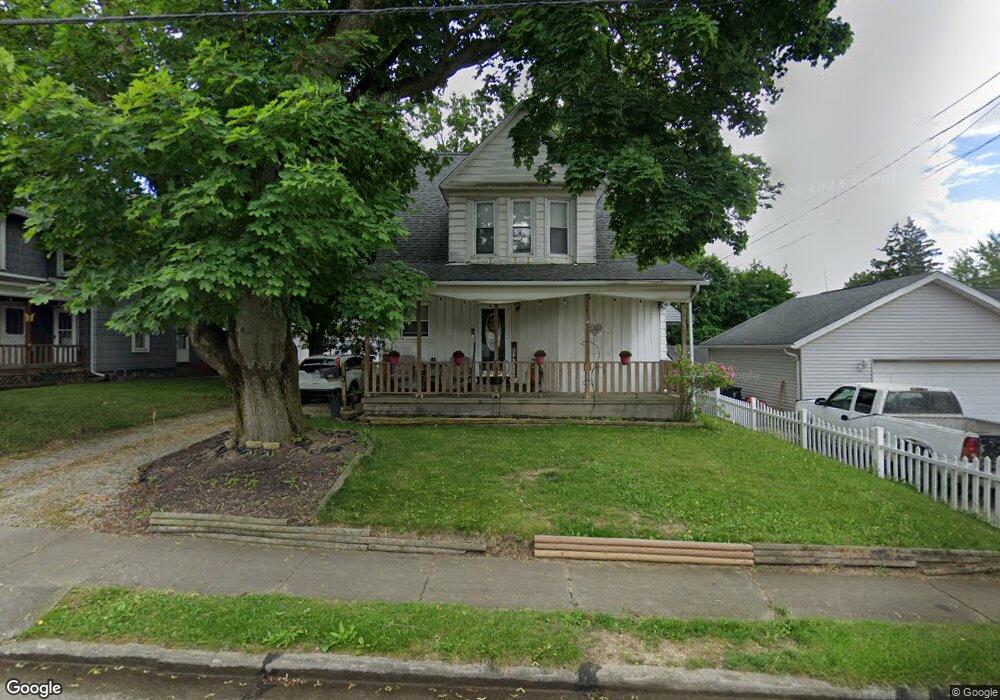
113 E Walnut St Wadsworth, OH 44281
Estimated Value: $146,000 - $187,000
3
Beds
1
Bath
1,654
Sq Ft
$98/Sq Ft
Est. Value
About This Home
This home is located at 113 E Walnut St, Wadsworth, OH 44281 and is currently estimated at $162,438, approximately $98 per square foot. 113 E Walnut St is a home located in Medina County with nearby schools including Franklin Elementary School, Central Intermediate School, and Wadsworth Middle School.
Ownership History
Date
Name
Owned For
Owner Type
Purchase Details
Closed on
May 20, 2016
Sold by
Mcmillen Cheryl R and Bates Cheyl
Bought by
Mcmillen Cheryl R
Current Estimated Value
Home Financials for this Owner
Home Financials are based on the most recent Mortgage that was taken out on this home.
Original Mortgage
$52,000
Outstanding Balance
$22,299
Interest Rate
2.86%
Mortgage Type
New Conventional
Estimated Equity
$140,139
Purchase Details
Closed on
Apr 20, 2001
Sold by
Mcmillen Cheryl R and Bates Cheryl
Bought by
Bates Charles and Bates Cheryl
Purchase Details
Closed on
Jul 7, 1995
Sold by
Bates Edna
Bought by
Mcmillen Cheryl R
Home Financials for this Owner
Home Financials are based on the most recent Mortgage that was taken out on this home.
Original Mortgage
$47,700
Interest Rate
7.9%
Mortgage Type
New Conventional
Create a Home Valuation Report for This Property
The Home Valuation Report is an in-depth analysis detailing your home's value as well as a comparison with similar homes in the area
Home Values in the Area
Average Home Value in this Area
Purchase History
| Date | Buyer | Sale Price | Title Company |
|---|---|---|---|
| Mcmillen Cheryl R | -- | None Available | |
| Bates Charles | -- | -- | |
| Mcmillen Cheryl R | $53,000 | -- |
Source: Public Records
Mortgage History
| Date | Status | Borrower | Loan Amount |
|---|---|---|---|
| Open | Mcmillen Cheryl R | $52,000 | |
| Previous Owner | Mcmillen Cheryl R | $47,700 |
Source: Public Records
Tax History
| Year | Tax Paid | Tax Assessment Tax Assessment Total Assessment is a certain percentage of the fair market value that is determined by local assessors to be the total taxable value of land and additions on the property. | Land | Improvement |
|---|---|---|---|---|
| 2024 | $1,076 | $34,190 | $10,940 | $23,250 |
| 2023 | $1,106 | $34,190 | $10,940 | $23,250 |
| 2022 | $1,126 | $34,190 | $10,940 | $23,250 |
| 2021 | $972 | $27,350 | $8,750 | $18,600 |
| 2020 | $857 | $27,350 | $8,750 | $18,600 |
| 2019 | $858 | $27,350 | $8,750 | $18,600 |
| 2018 | $690 | $22,750 | $8,260 | $14,490 |
| 2017 | $690 | $22,750 | $8,260 | $14,490 |
| 2016 | $701 | $22,750 | $8,260 | $14,490 |
| 2015 | $872 | $25,380 | $7,580 | $17,800 |
| 2014 | $886 | $25,380 | $7,580 | $17,800 |
| 2013 | $888 | $25,380 | $7,580 | $17,800 |
Source: Public Records
Map
Nearby Homes
- 155 W Walnut St
- 189 Pine St
- 247 Hillside Dr
- 595 Jessica Ln
- 683 Whippoorwill Ln
- 593 Silvercrest Rd
- 198 Summit St
- 135 Country Meadow Ln
- 281 High St
- 681 Oakcrest Dr
- 695 Hillcrest Dr
- 267 Marlow St
- 443 Plum Creek Dr
- 388 Crestwood Ave
- 0 Rosalind Ave
- 468 High St
- 295 High Point Dr
- 221 Franks Ave
- 228 Hartman Rd
- 751 Archwood Rd
Your Personal Tour Guide
Ask me questions while you tour the home.