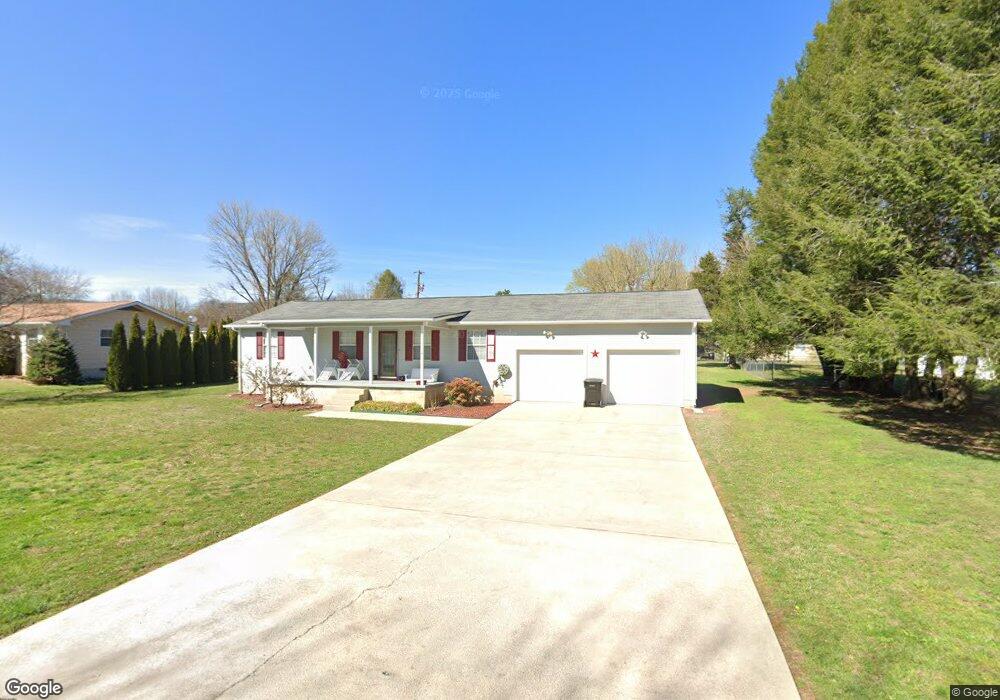
113 Ewton St Dunlap, TN 37327
Estimated Value: $191,726 - $274,000
--
Bed
2
Baths
1,232
Sq Ft
$185/Sq Ft
Est. Value
About This Home
This home is located at 113 Ewton St, Dunlap, TN 37327 and is currently estimated at $227,432, approximately $184 per square foot. 113 Ewton St is a home located in Sequatchie County with nearby schools including Griffith Elementary School, Sequatchie County Middle School, and Sequatchie County High School.
Ownership History
Date
Name
Owned For
Owner Type
Purchase Details
Closed on
Aug 13, 2025
Sold by
James Richard and James Dawn
Bought by
Johnson Clyde O and Johnson Susie M
Current Estimated Value
Purchase Details
Closed on
Dec 6, 2023
Sold by
Johnson Clyde O and Johnson Susie M
Bought by
James Richard and James Dawn
Purchase Details
Closed on
Dec 27, 2004
Bought by
Johnson Clyde O and Wife Susie M
Home Financials for this Owner
Home Financials are based on the most recent Mortgage that was taken out on this home.
Original Mortgage
$85,500
Interest Rate
5.63%
Purchase Details
Closed on
Nov 4, 1994
Sold by
Howard Farley
Bought by
Johnson Clyde O
Purchase Details
Closed on
Aug 27, 1993
Bought by
Farley Howard Donald and Wife Charlotte
Purchase Details
Closed on
Sep 3, 1989
Bought by
Riley James and Wife Lena
Create a Home Valuation Report for This Property
The Home Valuation Report is an in-depth analysis detailing your home's value as well as a comparison with similar homes in the area
Home Values in the Area
Average Home Value in this Area
Purchase History
| Date | Buyer | Sale Price | Title Company |
|---|---|---|---|
| Johnson Clyde O | -- | None Listed On Document | |
| James Richard | -- | Cumberland Title | |
| Johnson Clyde O | -- | -- | |
| Johnson Clyde O | $57,000 | -- | |
| Farley Howard Donald | $5,500 | -- | |
| Riley James | $5,000 | -- |
Source: Public Records
Mortgage History
| Date | Status | Borrower | Loan Amount |
|---|---|---|---|
| Previous Owner | Riley James | $85,500 |
Source: Public Records
Tax History Compared to Growth
Tax History
| Year | Tax Paid | Tax Assessment Tax Assessment Total Assessment is a certain percentage of the fair market value that is determined by local assessors to be the total taxable value of land and additions on the property. | Land | Improvement |
|---|---|---|---|---|
| 2025 | $1,016 | $43,400 | $0 | $0 |
| 2024 | $1,016 | $42,075 | $3,125 | $38,950 |
| 2023 | $1,016 | $42,075 | $3,125 | $38,950 |
| 2022 | $809 | $24,375 | $2,150 | $22,225 |
| 2021 | $796 | $24,375 | $2,150 | $22,225 |
| 2020 | $796 | $24,375 | $2,150 | $22,225 |
| 2019 | $796 | $24,375 | $2,150 | $22,225 |
| 2018 | $737 | $22,825 | $2,150 | $20,675 |
| 2017 | $729 | $22,825 | $2,150 | $20,675 |
| 2016 | $759 | $22,775 | $2,150 | $20,625 |
| 2015 | $759 | $22,775 | $2,150 | $20,625 |
| 2014 | $759 | $22,775 | $2,150 | $20,625 |
Source: Public Records
Map
Nearby Homes
- 345 Angel Oak Dr
- 397 Angel Oak Dr
- 381 Angel Oak Dr
- 267 Williams Rd
- 195 Angel Oak Dr
- 448 Angel Oak Dr
- 101 Angel Oak Dr
- 217 A Day Dream Dr
- 44 Bear Oak Dr
- 137 Angel Oak Dr
- 465 Brush Creek Rd
- 79 Bear Oak Dr
- 91 Scarlet Oak Dr
- 110 Bear Oak Dr
- 56 Scarlet Oak Dr
- 239 Bear Oak Dr
- 128 Scarlet Oak Dr
- 129 Scarlet Oak Dr