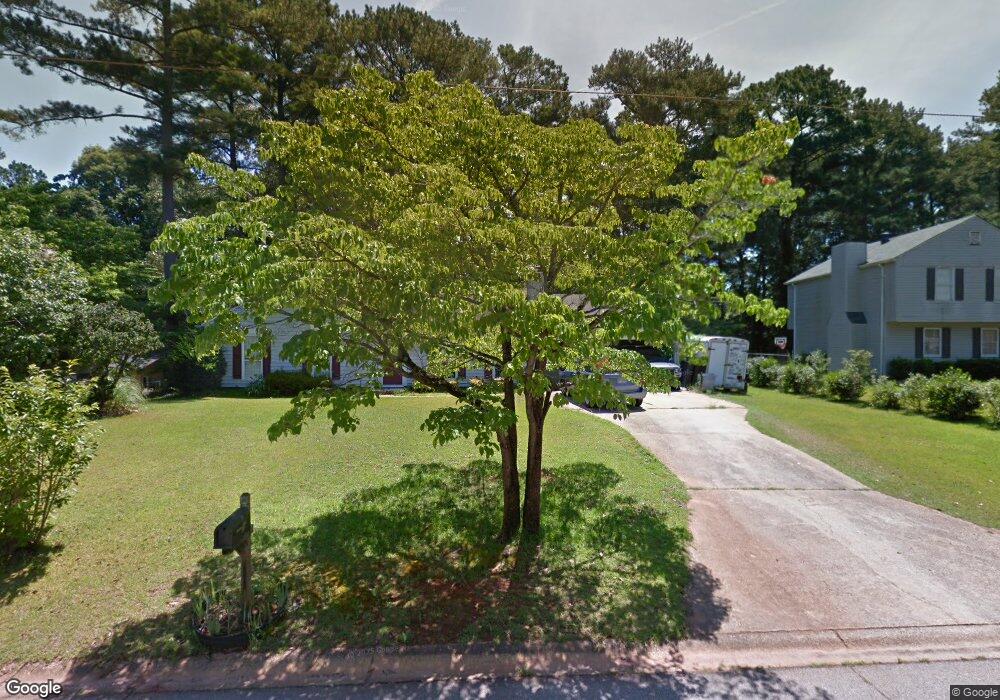
113 Fairview Way Unit I Stockbridge, GA 30281
Estimated Value: $208,000 - $221,000
3
Beds
2
Baths
1,527
Sq Ft
$142/Sq Ft
Est. Value
About This Home
This home is located at 113 Fairview Way Unit I, Stockbridge, GA 30281 and is currently estimated at $216,112, approximately $141 per square foot. 113 Fairview Way Unit I is a home located in Henry County with nearby schools including Austin Road Elementary School, Austin Road Middle School, and Woodland High School.
Ownership History
Date
Name
Owned For
Owner Type
Purchase Details
Closed on
Jan 31, 2022
Sold by
Compass Homes Llc
Bought by
Irby Emmett and Irby Monica
Current Estimated Value
Home Financials for this Owner
Home Financials are based on the most recent Mortgage that was taken out on this home.
Original Mortgage
$145,500
Outstanding Balance
$134,867
Interest Rate
3.56%
Mortgage Type
Cash
Estimated Equity
$81,245
Purchase Details
Closed on
Oct 26, 2017
Sold by
Law John R
Bought by
Compass Homes Llc
Purchase Details
Closed on
May 17, 2002
Sold by
Tandem Cap Sources Inc
Bought by
Law John R and Law Arlene N
Home Financials for this Owner
Home Financials are based on the most recent Mortgage that was taken out on this home.
Original Mortgage
$85,500
Interest Rate
6.98%
Mortgage Type
New Conventional
Purchase Details
Closed on
Apr 14, 2000
Sold by
Smith Annette E
Bought by
Smith Annette E and Smith Franklin D
Create a Home Valuation Report for This Property
The Home Valuation Report is an in-depth analysis detailing your home's value as well as a comparison with similar homes in the area
Home Values in the Area
Average Home Value in this Area
Purchase History
| Date | Buyer | Sale Price | Title Company |
|---|---|---|---|
| Irby Emmett | $150,000 | -- | |
| Compass Homes Llc | -- | -- | |
| Law John R | $95,000 | -- | |
| Smith Annette E | -- | -- |
Source: Public Records
Mortgage History
| Date | Status | Borrower | Loan Amount |
|---|---|---|---|
| Open | Irby Emmett | $145,500 | |
| Previous Owner | Law John R | $85,500 |
Source: Public Records
Tax History Compared to Growth
Tax History
| Year | Tax Paid | Tax Assessment Tax Assessment Total Assessment is a certain percentage of the fair market value that is determined by local assessors to be the total taxable value of land and additions on the property. | Land | Improvement |
|---|---|---|---|---|
| 2025 | $2,667 | $81,640 | $14,000 | $67,640 |
| 2024 | $2,667 | $80,120 | $14,000 | $66,120 |
| 2023 | $1,566 | $60,000 | $10,320 | $49,680 |
| 2022 | $2,555 | $65,560 | $10,000 | $55,560 |
| 2021 | $2,012 | $51,400 | $10,000 | $41,400 |
| 2020 | $1,877 | $47,880 | $8,000 | $39,880 |
| 2019 | $1,791 | $45,640 | $8,000 | $37,640 |
| 2018 | $1,588 | $40,360 | $6,000 | $34,360 |
| 2016 | $1,321 | $33,400 | $6,000 | $27,400 |
| 2015 | $1,100 | $26,800 | $6,000 | $20,800 |
| 2014 | $933 | $22,320 | $4,000 | $18,320 |
Source: Public Records
Map
Nearby Homes
- 203 Farmbrook Pkwy
- 130 Fairview Dr
- 106 Garden Trail
- 25 Mendy Ln
- 80 Sandy Dr
- 216 Johns Creek Ln
- 222 Farmbrook Pkwy
- 200 Johns Creek Ln
- 226 Farmbrook Pkwy
- 204 Benefield Ct
- 313 Ashborough Place
- 154 Johns Creek Ln
- 780 Gardner Rd
- 176 Fairoaks Cir
- 128 Crown Glen Way
- 509 Tall Pines Ct
- 1080 Gardner Rd
- 1110 Estates Ct
- 1100 Gardner Rd
- 40 Lake Ct
- 113 Fairview Rd
- 111 Fairview Way
- 111 Fairview Way Unit 1
- 109 Fairview Way
- 115 Park Place
- 117 Fairview Way
- 114 Fairview Place
- 107 Fairview Way
- 118 Fairview Way
- 118 Fairview Way Unit 850
- 118 Fairview Way Unit I
- 113 Park Place
- 119 Fairview Way Unit 1
- 110 Fairview Place
- 112 Park Place
- 111 Park Place Unit 1
- 105 Fairview Way
- 121 Fairview Way Unit 1
- 113 Fairview Place
- 110 Park Place