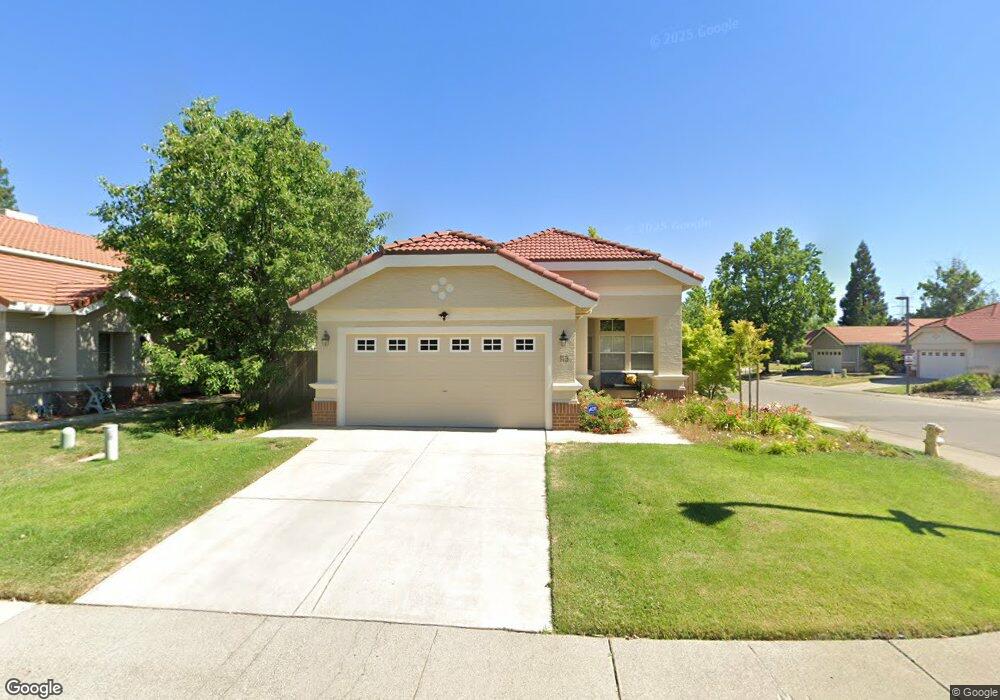
113 Harcourt Way Folsom, CA 95630
Broadstone NeighborhoodEstimated Value: $507,000 - $688,000
3
Beds
2
Baths
1,352
Sq Ft
$456/Sq Ft
Est. Value
About This Home
This home is located at 113 Harcourt Way, Folsom, CA 95630 and is currently estimated at $616,900, approximately $456 per square foot. 113 Harcourt Way is a home located in Sacramento County with nearby schools including Gold Ridge Elementary School, Sutter Middle School, and Folsom High School.
Ownership History
Date
Name
Owned For
Owner Type
Purchase Details
Closed on
Nov 30, 2004
Sold by
Mccargar Daniel
Bought by
Berchtold Delores Ann
Current Estimated Value
Home Financials for this Owner
Home Financials are based on the most recent Mortgage that was taken out on this home.
Original Mortgage
$319,200
Outstanding Balance
$156,011
Interest Rate
5.37%
Mortgage Type
Purchase Money Mortgage
Estimated Equity
$460,889
Purchase Details
Closed on
Apr 25, 2002
Sold by
Mccargar Daniel and Dasilva Janice
Bought by
Mccargar Daniel
Home Financials for this Owner
Home Financials are based on the most recent Mortgage that was taken out on this home.
Original Mortgage
$180,000
Interest Rate
7.08%
Purchase Details
Closed on
May 20, 1997
Sold by
Cheung Raymond Wing and Cheung Rina R
Bought by
Mccargar Daniel and Dasilva Janice
Home Financials for this Owner
Home Financials are based on the most recent Mortgage that was taken out on this home.
Original Mortgage
$131,022
Interest Rate
8.14%
Mortgage Type
FHA
Create a Home Valuation Report for This Property
The Home Valuation Report is an in-depth analysis detailing your home's value as well as a comparison with similar homes in the area
Home Values in the Area
Average Home Value in this Area
Purchase History
| Date | Buyer | Sale Price | Title Company |
|---|---|---|---|
| Berchtold Delores Ann | $399,000 | California Title Company Of | |
| Mccargar Daniel | -- | Fidelity National Title Co | |
| Mccargar Daniel | $134,500 | Golden California Title Co |
Source: Public Records
Mortgage History
| Date | Status | Borrower | Loan Amount |
|---|---|---|---|
| Open | Berchtold Delores Ann | $319,200 | |
| Previous Owner | Mccargar Daniel | $180,000 | |
| Previous Owner | Mccargar Daniel | $131,022 | |
| Closed | Berchtold Delores Ann | $58,950 |
Source: Public Records
Tax History Compared to Growth
Tax History
| Year | Tax Paid | Tax Assessment Tax Assessment Total Assessment is a certain percentage of the fair market value that is determined by local assessors to be the total taxable value of land and additions on the property. | Land | Improvement |
|---|---|---|---|---|
| 2025 | $6,072 | $556,156 | $132,414 | $423,742 |
| 2024 | $6,072 | $545,252 | $129,818 | $415,434 |
| 2023 | $5,966 | $534,562 | $127,273 | $407,289 |
| 2022 | $5,879 | $524,081 | $124,778 | $399,303 |
| 2021 | $5,801 | $513,806 | $122,332 | $391,474 |
| 2020 | $5,730 | $508,538 | $121,078 | $387,460 |
| 2019 | $5,729 | $498,567 | $118,704 | $379,863 |
| 2018 | $5,593 | $488,792 | $116,377 | $372,415 |
| 2017 | $4,971 | $454,037 | $108,103 | $345,934 |
| 2016 | $5,228 | $420,406 | $100,096 | $320,310 |
| 2015 | $4,959 | $392,904 | $93,548 | $299,356 |
| 2014 | $4,651 | $385,200 | $91,714 | $293,486 |
Source: Public Records
Map
Nearby Homes
- 101 Kennerly Way
- 646 Cullingworth Ct
- 1205 Albrighton Dr
- 757 Hatherden Ct
- 105 Hamersley Ct
- 1227 Halidon Way
- 101 Duxbury Way
- 104 Hesser Ct
- 2142 Haverhill Dr
- 408-408 1/2 Reading St
- 4110 Oakridge Ln
- 100 Black Gold Ln
- 102 Black Gold Ln
- 1038 Pintail Cir
- 108 Bloomfield Way
- 770 Halidon Way
- 0 Figueroa St Unit 225034113
- 1468 Farrell Ct
- 885 Halidon Way Unit 1428
- 885 Halidon Way Unit 923
- 111 Harcourt Way
- 109 Harcourt Way
- 101 Moylan Ct
- 103 Moylan Ct
- 105 Sedgeford Way
- 107 Sedgeford Way
- 100 Sedgeford Ct
- 107 Harcourt Way
- 103 Sedgeford Way
- 109 Sedgeford Way
- 105 Moylan Ct
- 101 Sedgeford Way
- 101 Sedgeford Ct
- 105 Harcourt Way
- 102 Sedgeford Ct
- 107 Moylan Ct
- 103 Sedgeford Ct
- 109 Moylan Ct
- 103 Harcourt Way
- 104 Grantham Ct