113 Johnson St Unit 115 Springfield, MA 01108
Forest Park NeighborhoodEstimated Value: $325,321 - $371,000
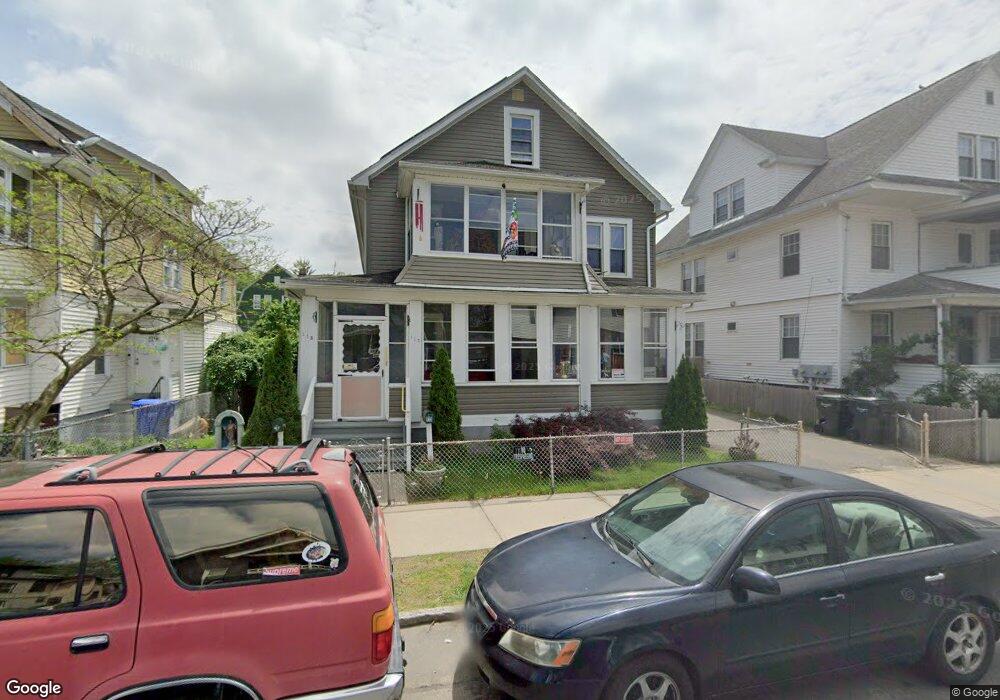
About This Home
This home is located at 113 Johnson St Unit 115, Springfield, MA 01108 and is currently estimated at $353,080, approximately $142 per square foot. 113 Johnson St Unit 115 is a home located in Hampden County with nearby schools including White Street Elementary School, Forest Park Middle School, and High School Of Commerce.
Ownership History
We collect this data history from publicly available records. To have your information removed, we recommend requesting removal directly through your county’s website.
Purchase Details
Home Financials for this Owner
Home Financials are based on the most recent Mortgage that was taken out on this home.Home Values in the Area
Average Home Value in this Area
Purchase History
We collect this data history from publicly available records. To have your information removed, we recommend requesting removal directly through your county’s website.
| Date | Buyer | Sale Price | Title Company |
|---|---|---|---|
| $54,900 | -- |
Mortgage History
We collect this data history from publicly available records. To have your information removed, we recommend requesting removal directly through your county’s website.
| Date | Status | Borrower | Loan Amount |
|---|---|---|---|
| Open | $52,100 | ||
| Closed | $1,598 |
Tax History
We collect this data history from publicly available records. To have your information removed, we recommend requesting removal directly through your county’s website.
| Year | Tax Paid | Tax Assessment Tax Assessment Total Assessment is a certain percentage of the fair market value that is determined by local assessors to be the total taxable value of land and additions on the property. | Land | Improvement |
|---|---|---|---|---|
| 2025 | $4,441 | $283,200 | $31,200 | $252,000 |
| 2024 | $4,474 | $278,600 | $31,200 | $247,400 |
| 2023 | $3,925 | $230,200 | $28,400 | $201,800 |
| 2022 | $3,292 | $174,900 | $26,500 | $148,400 |
| 2021 | $3,139 | $166,100 | $24,100 | $142,000 |
| 2020 | $3,099 | $158,700 | $24,100 | $134,600 |
| 2019 | $2,928 | $148,800 | $24,100 | $124,700 |
| 2018 | $2,804 | $142,500 | $24,100 | $118,400 |
| 2017 | $2,646 | $134,600 | $22,600 | $112,000 |
| 2016 | $2,312 | $117,600 | $22,600 | $95,000 |
| 2015 | $2,270 | $115,400 | $22,600 | $92,800 |
Map
- 37-39 Wilmont St
- 16-18 Alderman St
- 115 Pasadena St
- 192 White St
- 8 Vermont St
- 350 Dickinson St
- 74 Kenwood Park
- 19 Wareham St
- 310 Oakland St
- 7-9 Glendell Terrace
- 65-67 Mansfield St
- 172-174 Euclid Ave
- 32 Randall Place
- 72 Hall St
- 83 Kimberly Ave
- 704-708 Sumner Ave
- 42 Hall St
- 13-15 Wigwam Place
- 47 Keith St
- 120-122 E Alvord St
- 124-126 Johnson St
- 124 Johnson St Unit 126
- 120 Johnson St Unit 122
- 130 Johnson St Unit 132
- 130-132 Johnson St
- 116 Johnson St Unit 118
- 116 Johnson St Unit 1
- 134 Johnson St Unit 136
- 134 Johnson St
- 125 Bloomfield St Unit 127
- 110 Johnson St Unit 112
- 119 Bloomfield St Unit 121
- 140 Johnson St Unit 142
- 123 Johnson St Unit 125
- 131 Bloomfield St Unit 133
- 129 Johnson St Unit 131
- 119 Johnson St Unit 121
- 41 Johnson St
- 41 Johnson St
- 41 Johnson St Unit 2L
Ask me questions while you tour the home.