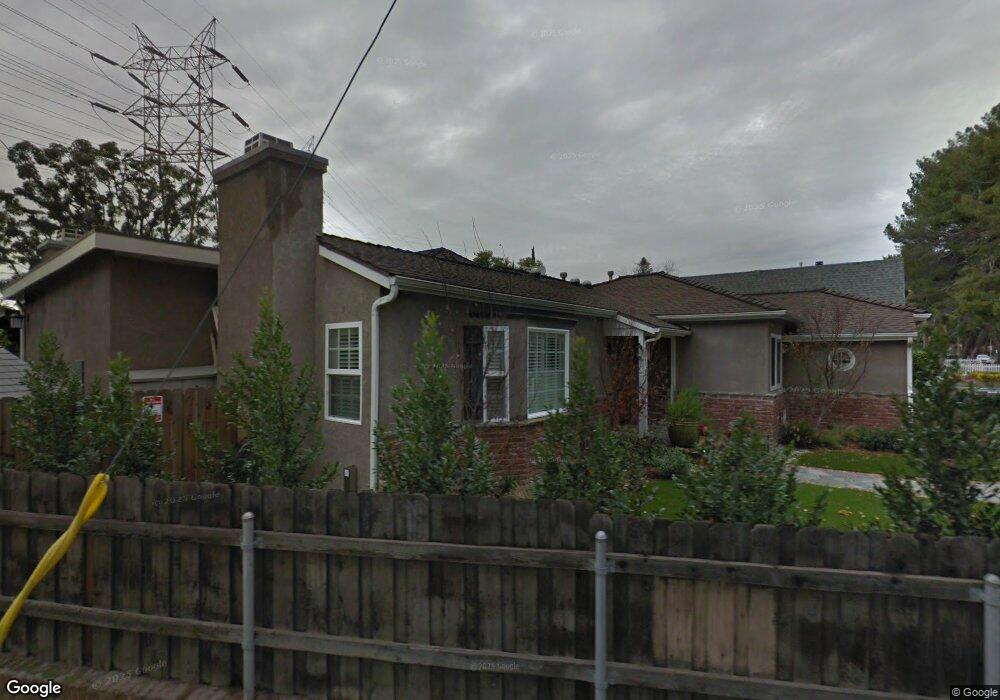
113 N Niagara St Burbank, CA 91505
Media District NeighborhoodEstimated Value: $1,501,000 - $2,011,080
5
Beds
4
Baths
3,597
Sq Ft
$467/Sq Ft
Est. Value
About This Home
This home is located at 113 N Niagara St, Burbank, CA 91505 and is currently estimated at $1,678,770, approximately $466 per square foot. 113 N Niagara St is a home located in Los Angeles County with nearby schools including R. L. Stevenson Elementary School, Dolores Huerta Middle School, and John Burroughs High School.
Ownership History
Date
Name
Owned For
Owner Type
Purchase Details
Closed on
Oct 21, 2011
Sold by
Jackson Keith W and Jackson Laura J
Bought by
The Keith W & Laura J Jackson Living Tru
Current Estimated Value
Home Financials for this Owner
Home Financials are based on the most recent Mortgage that was taken out on this home.
Original Mortgage
$483,500
Outstanding Balance
$327,371
Interest Rate
3.95%
Mortgage Type
New Conventional
Estimated Equity
$1,351,399
Purchase Details
Closed on
Sep 2, 2009
Sold by
Jackson Keith W and Jackson Laura J
Bought by
Jackson Keith W and Jackson Laura J
Purchase Details
Closed on
Feb 26, 2002
Sold by
Castex Rentals Inc
Bought by
Jackson Keith W and Jackson Laura J
Home Financials for this Owner
Home Financials are based on the most recent Mortgage that was taken out on this home.
Original Mortgage
$300,000
Interest Rate
6.78%
Create a Home Valuation Report for This Property
The Home Valuation Report is an in-depth analysis detailing your home's value as well as a comparison with similar homes in the area
Home Values in the Area
Average Home Value in this Area
Purchase History
| Date | Buyer | Sale Price | Title Company |
|---|---|---|---|
| The Keith W & Laura J Jackson Living Tru | -- | Lsi | |
| Jackson Keith W | -- | Lsi | |
| Jackson Keith W | -- | None Available | |
| Jackson Keith W | $400,000 | Old Republic Title |
Source: Public Records
Mortgage History
| Date | Status | Borrower | Loan Amount |
|---|---|---|---|
| Open | Jackson Keith W | $483,500 | |
| Closed | Jackson Keith W | $300,000 |
Source: Public Records
Tax History Compared to Growth
Tax History
| Year | Tax Paid | Tax Assessment Tax Assessment Total Assessment is a certain percentage of the fair market value that is determined by local assessors to be the total taxable value of land and additions on the property. | Land | Improvement |
|---|---|---|---|---|
| 2025 | $8,687 | $770,842 | $354,539 | $416,303 |
| 2024 | $8,687 | $755,729 | $347,588 | $408,141 |
| 2023 | $8,596 | $740,912 | $340,773 | $400,139 |
| 2022 | $8,215 | $726,386 | $334,092 | $392,294 |
| 2021 | $8,166 | $712,144 | $327,542 | $384,602 |
| 2020 | $8,075 | $704,843 | $324,184 | $380,659 |
| 2019 | $7,840 | $691,024 | $317,828 | $373,196 |
| 2018 | $7,682 | $677,476 | $311,597 | $365,879 |
| 2016 | $7,269 | $651,171 | $299,499 | $351,672 |
| 2015 | $7,122 | $641,391 | $295,001 | $346,390 |
| 2014 | $7,111 | $628,828 | $289,223 | $339,605 |
Source: Public Records
Map
Nearby Homes
- 210 N Niagara St
- 315 N Catalina St
- 340 N California St
- 3311 W Alameda Ave
- 211 N Frederic St
- 421 N Catalina St
- 215 N Cordova St
- 216 N Buena Vista St Unit 101
- 505 N Avon St
- 238 S Lincoln St
- 625 N Niagara St
- 2016 W Oak St
- 125 N Keystone St
- 355 N Maple St Unit 242
- 355 N Maple St Unit 209
- 355 N Maple St Unit 243
- 735 N Lima St
- 405 N Brighton St
- 335 S Parish Place
- 114 S Lamer St
- 121 N Niagara St
- 130 N Fairview St
- 125 N Niagara St
- 132 N Fairview St
- 3003 W Olive Ave
- 136 N Fairview St
- 129 N Niagara St
- 140 N Fairview St
- 201 N Niagara St
- 124 N Niagara St
- 200 N Fairview St
- 205 N Niagara St
- 128 N Niagara St
- 204 N Fairview St
- 200 N Niagara St
- 209 N Niagara St
- 204 N Niagara St
- 103 N Whitnall Hwy
- 105 N Whitnall Hwy