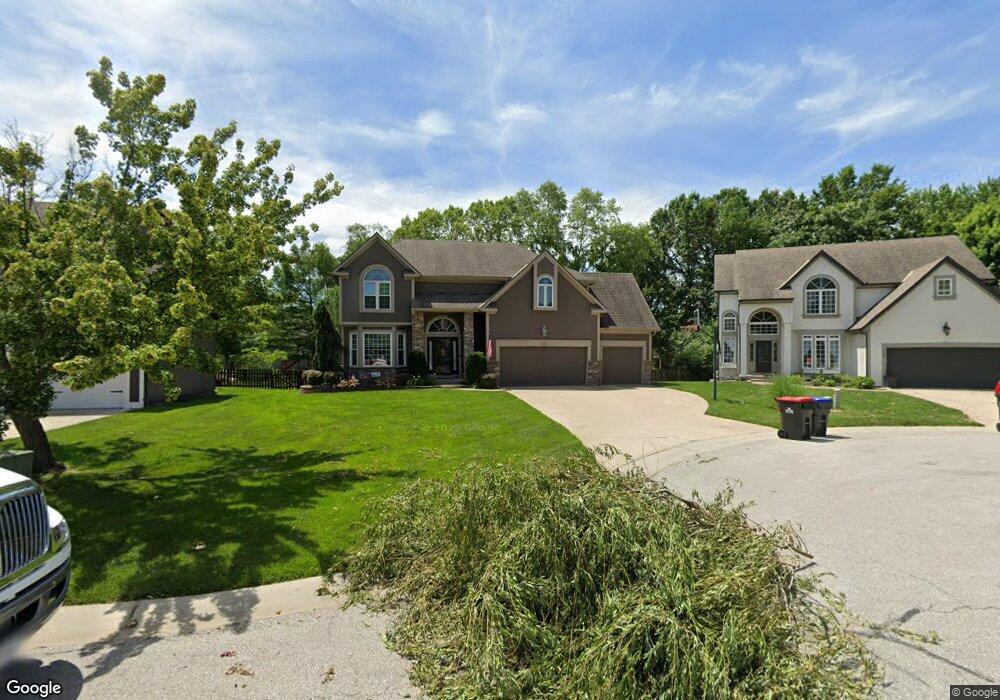
113 NE Parks View Ct Lees Summit, MO 64064
Chapel Ridge NeighborhoodEstimated Value: $481,015 - $581,000
4
Beds
5
Baths
2,469
Sq Ft
$212/Sq Ft
Est. Value
About This Home
This home is located at 113 NE Parks View Ct, Lees Summit, MO 64064 and is currently estimated at $522,754, approximately $211 per square foot. 113 NE Parks View Ct is a home located in Jackson County with nearby schools including Voy Spears Jr. Elementary School, Delta Woods Middle School, and Blue Springs South High School.
Ownership History
Date
Name
Owned For
Owner Type
Purchase Details
Closed on
Jul 6, 2004
Sold by
Shireman Md Thomas J and Shireman Cheryl L
Bought by
Shireman Cheryl L and Cheryl L Shireman Trust
Current Estimated Value
Purchase Details
Closed on
Jul 26, 2002
Sold by
Shireman Thomas J and Shireman Cheryl L
Bought by
Shireman Md Thomas J and Shireman Cheryl L
Home Financials for this Owner
Home Financials are based on the most recent Mortgage that was taken out on this home.
Original Mortgage
$200,000
Interest Rate
6.08%
Mortgage Type
Purchase Money Mortgage
Purchase Details
Closed on
Mar 8, 2001
Sold by
Shireman Thomas J and Shireman Cheryl L
Bought by
Shireman Md Thomas J and Shireman Cheryl L
Purchase Details
Closed on
Jul 17, 2000
Sold by
Innovative Development Inc
Bought by
Shireman Thomas J and Shireman Cheryl L
Home Financials for this Owner
Home Financials are based on the most recent Mortgage that was taken out on this home.
Original Mortgage
$196,100
Interest Rate
8.36%
Mortgage Type
Purchase Money Mortgage
Create a Home Valuation Report for This Property
The Home Valuation Report is an in-depth analysis detailing your home's value as well as a comparison with similar homes in the area
Home Values in the Area
Average Home Value in this Area
Purchase History
| Date | Buyer | Sale Price | Title Company |
|---|---|---|---|
| Shireman Cheryl L | -- | -- | |
| Shireman Cheryl L | -- | -- | |
| Shireman Md Thomas J | -- | -- | |
| Shireman Thomas J | -- | -- | |
| Shireman Md Thomas J | -- | -- | |
| Shireman Thomas J | -- | Security Land Title Company |
Source: Public Records
Mortgage History
| Date | Status | Borrower | Loan Amount |
|---|---|---|---|
| Closed | Shireman Thomas J | $200,000 | |
| Closed | Shireman Thomas J | $196,100 |
Source: Public Records
Tax History Compared to Growth
Tax History
| Year | Tax Paid | Tax Assessment Tax Assessment Total Assessment is a certain percentage of the fair market value that is determined by local assessors to be the total taxable value of land and additions on the property. | Land | Improvement |
|---|---|---|---|---|
| 2025 | $5,820 | $82,920 | $14,315 | $68,605 |
| 2024 | $5,716 | $76,000 | $8,721 | $67,279 |
| 2023 | $5,716 | $76,000 | $10,247 | $65,753 |
| 2022 | $5,325 | $62,700 | $8,593 | $54,107 |
| 2021 | $5,320 | $62,700 | $8,593 | $54,107 |
| 2020 | $5,120 | $59,681 | $8,593 | $51,088 |
| 2019 | $4,963 | $59,681 | $8,593 | $51,088 |
| 2018 | $1,419,120 | $51,941 | $7,478 | $44,463 |
| 2017 | $4,260 | $51,941 | $7,478 | $44,463 |
| 2016 | $4,260 | $49,856 | $6,536 | $43,320 |
| 2014 | $4,030 | $46,877 | $6,534 | $40,343 |
Source: Public Records
Map
Nearby Homes
- 5900 NE Hidden Valley Dr
- 5808 NE Coral Dr
- 327 NE Lakes Edge Cir
- 5937 NE Hidden Valley Dr
- 400 NE Emerald Dr
- 5920 NE Coral Cir
- 5623 NW Sunrise Meadow Cir
- 5605 NE Misty Meadow Place
- 5615 NE Maybrook Rd
- 5605 NE Coral Dr
- 5704 NE Pearl Ct
- 5556 NW Moonlight Meadow Dr
- 5570 NW Sunrise Meadow Ln
- 5854 NW Plantation Ln
- 5115 S Shrank Ave
- 5816 NE Diamond Ct
- 5416 NE Northgate Crossing
- 5410 S Coachman Ave
- 5436 S Coachman Ave
- 16702 E 53rd St S Unit 17
- 109 NE Parks View Ct
- 117 NE Parks View Ct
- 148 NE Hidden Meadow Ln
- 152 NE Hidden Meadow Ln
- 105 NE Parks View Ct
- 156 NE Hidden Meadow Ln
- 144 NE Hidden Meadow Ln
- 121 NE Parks View Ct
- 160 NE Hidden Meadow Ln
- 133 NE Parks View Ct
- 140 NE Hidden Meadow Ln
- 125 NE Parks View Ct
- 129 NE Parks View Ct
- 200 NE Hidden Meadow Ln
- 137 NE Parks View Ct
- 119 NE Hidden Valley Ln
- 5900 NE Hidden Valley Rd
- 117 NE Hidden Meadow Ln
- 113 NE Hidden Meadow Ln
- 125 NE Hidden Meadow Ln