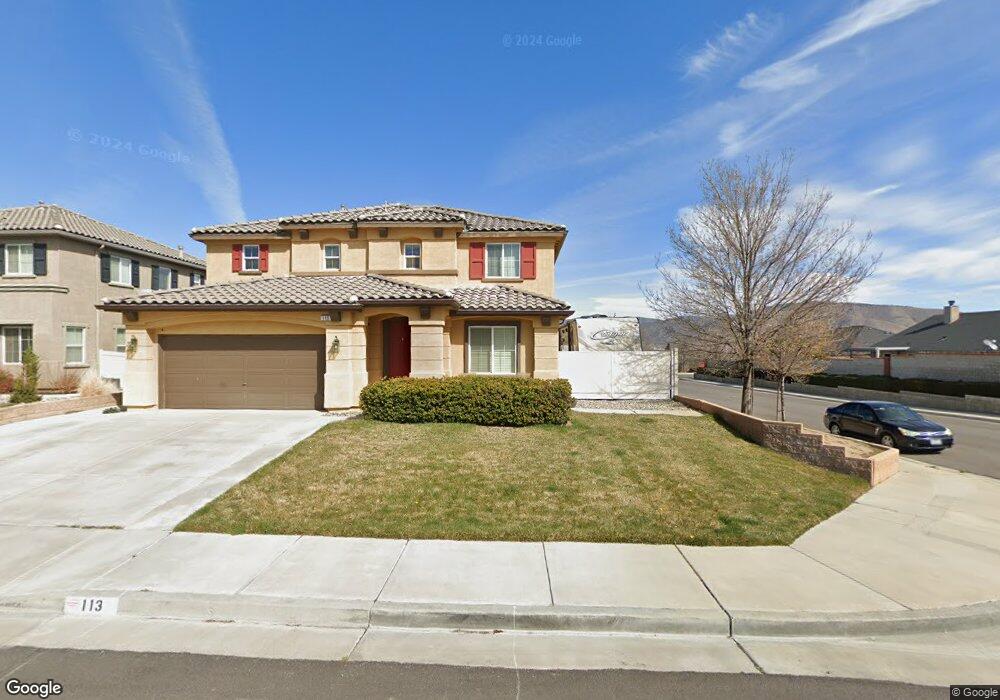
113 Oak Place Tehachapi, CA 93561
Estimated Value: $496,528 - $607,000
5
Beds
3
Baths
2,543
Sq Ft
$216/Sq Ft
Est. Value
About This Home
This home is located at 113 Oak Place, Tehachapi, CA 93561 and is currently estimated at $548,132, approximately $215 per square foot. 113 Oak Place is a home located in Kern County with nearby schools including Tompkins Elementary School, Jacobsen Middle School, and Tehachapi High School.
Ownership History
Date
Name
Owned For
Owner Type
Purchase Details
Closed on
Dec 17, 2021
Sold by
Short Darren P
Bought by
Short Darren P and Short Tammy A
Current Estimated Value
Home Financials for this Owner
Home Financials are based on the most recent Mortgage that was taken out on this home.
Original Mortgage
$145,000
Outstanding Balance
$112,731
Interest Rate
2.39%
Mortgage Type
New Conventional
Estimated Equity
$435,401
Purchase Details
Closed on
Sep 13, 2011
Sold by
Evans Brian W and Evans Denise
Bought by
Short Darren P
Home Financials for this Owner
Home Financials are based on the most recent Mortgage that was taken out on this home.
Original Mortgage
$224,870
Interest Rate
4.16%
Mortgage Type
New Conventional
Purchase Details
Closed on
Sep 16, 2005
Sold by
Kb Home Greater Los Angeles Inc
Bought by
Evans Brian W and Evans Denise
Home Financials for this Owner
Home Financials are based on the most recent Mortgage that was taken out on this home.
Original Mortgage
$299,200
Interest Rate
6.62%
Mortgage Type
Fannie Mae Freddie Mac
Create a Home Valuation Report for This Property
The Home Valuation Report is an in-depth analysis detailing your home's value as well as a comparison with similar homes in the area
Home Values in the Area
Average Home Value in this Area
Purchase History
| Date | Buyer | Sale Price | Title Company |
|---|---|---|---|
| Short Darren P | $72,500 | Chicago Title Company | |
| Short Darren P | $217,000 | First American Title Company | |
| Evans Brian W | $374,500 | First American Title |
Source: Public Records
Mortgage History
| Date | Status | Borrower | Loan Amount |
|---|---|---|---|
| Open | Short Darren P | $145,000 | |
| Previous Owner | Short Darren P | $224,870 | |
| Previous Owner | Evans Brian W | $299,200 |
Source: Public Records
Tax History
| Year | Tax Paid | Tax Assessment Tax Assessment Total Assessment is a certain percentage of the fair market value that is determined by local assessors to be the total taxable value of land and additions on the property. | Land | Improvement |
|---|---|---|---|---|
| 2025 | $3,492 | $272,549 | $31,394 | $241,155 |
| 2024 | $3,369 | $267,206 | $30,779 | $236,427 |
| 2023 | $3,369 | $261,968 | $30,176 | $231,792 |
| 2022 | $3,321 | $256,833 | $29,585 | $227,248 |
| 2021 | $3,266 | $251,798 | $29,005 | $222,793 |
| 2020 | $3,273 | $249,217 | $28,708 | $220,509 |
| 2019 | $3,263 | $249,217 | $28,708 | $220,509 |
| 2018 | $3,148 | $239,543 | $27,595 | $211,948 |
| 2017 | $3,135 | $234,847 | $27,054 | $207,793 |
| 2016 | $3,050 | $230,243 | $26,524 | $203,719 |
| 2015 | $2,905 | $226,785 | $26,126 | $200,659 |
| 2014 | $2,874 | $222,344 | $25,615 | $196,729 |
Source: Public Records
Map
Nearby Homes
- 1311 Wild Olive Rd
- 1331 S Green St
- 221 Cassano Dr
- 260 Pinon St
- 23860 El Rancho Dr
- 403 Mesquite Dr
- 504 Rosehaven Ln
- 504 Mesquite Dr
- 0 Pinon St
- 0 Fir St
- 1021 S Green St
- 1360 Bodega Dr
- 1013 Cypress Way
- 210 Pinon St Unit 11
- 210 Pinon St Unit 18
- 210 Pinon St Unit 4
- 210 Pinon St Unit 1
- 210 Pinon St Unit 6
- 210 Pinon St Unit 15
- 210 Pinon St Unit 5
- 111 Oak Place
- 109 Oak Place
- 1309 Ponderosa Dr
- 1309 Scarlet Oak Dr
- 1313 Scarlet Oak Dr Unit A
- 1308 Wild Olive Rd
- 1305 Scarlet Oak Dr Unit A
- 107 Oak Place
- 1311 Ponderosa Dr
- 106 Mesquite Dr Unit C
- 1317 Scarlet Oak Dr
- 1301 Scarlet Oak Dr
- 105 Oak Place
- 104 Mesquite Dr Unit C
- 1321 Scarlet Oak Dr
- 1331 Ponderosa Dr
- 1224 Catalpa Ct
- 1330 Wild Olive Rd
- 1309 Wild Olive Rd
- 1310 Wild Olive Rd