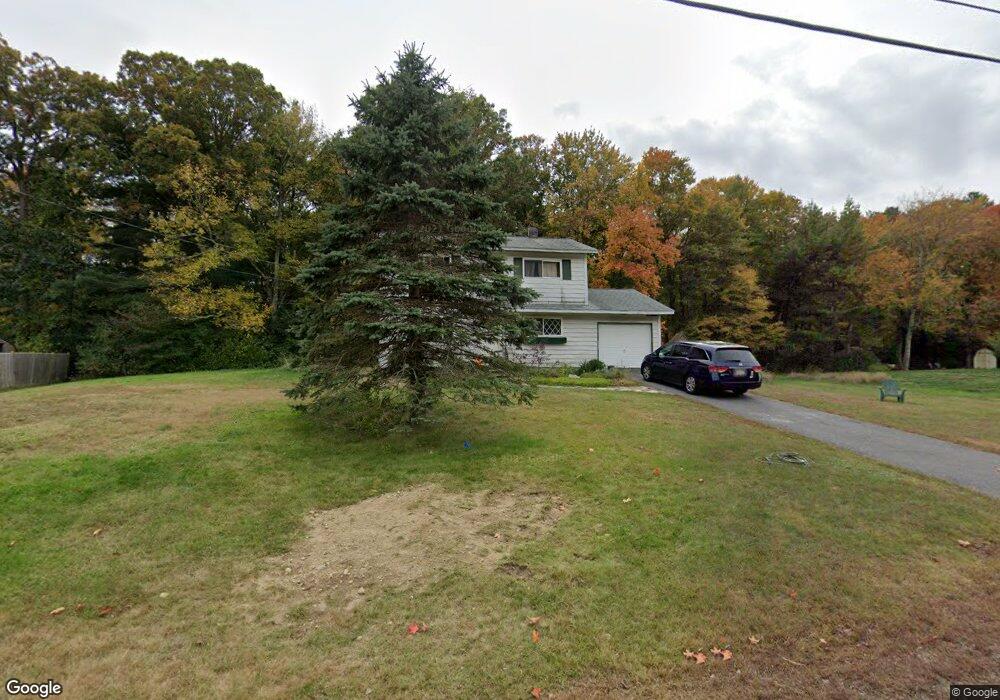
113 Plymouth Rd Hanover, MA 02339
Estimated Value: $628,000 - $792,000
4
Beds
2
Baths
1,440
Sq Ft
$493/Sq Ft
Est. Value
About This Home
This home is located at 113 Plymouth Rd, Hanover, MA 02339 and is currently estimated at $709,619, approximately $492 per square foot. 113 Plymouth Rd is a home located in Plymouth County with nearby schools including Hanover High School, Cadence Academy Preschool - Hanover, and Cardinal Cushing Centers.
Ownership History
Date
Name
Owned For
Owner Type
Purchase Details
Closed on
Feb 29, 2008
Sold by
Shanley Mark E and Shanley John W
Bought by
Obrien Angela M and Obrien Dennis
Current Estimated Value
Home Financials for this Owner
Home Financials are based on the most recent Mortgage that was taken out on this home.
Original Mortgage
$32,000
Outstanding Balance
$20,000
Interest Rate
5.8%
Mortgage Type
Purchase Money Mortgage
Estimated Equity
$689,619
Create a Home Valuation Report for This Property
The Home Valuation Report is an in-depth analysis detailing your home's value as well as a comparison with similar homes in the area
Home Values in the Area
Average Home Value in this Area
Purchase History
| Date | Buyer | Sale Price | Title Company |
|---|---|---|---|
| Obrien Angela M | $320,000 | -- |
Source: Public Records
Mortgage History
| Date | Status | Borrower | Loan Amount |
|---|---|---|---|
| Open | Obrien Angela M | $32,000 | |
| Previous Owner | Obrien Angela M | $10,000 |
Source: Public Records
Tax History Compared to Growth
Tax History
| Year | Tax Paid | Tax Assessment Tax Assessment Total Assessment is a certain percentage of the fair market value that is determined by local assessors to be the total taxable value of land and additions on the property. | Land | Improvement |
|---|---|---|---|---|
| 2025 | $7,621 | $617,100 | $271,000 | $346,100 |
| 2024 | $7,487 | $583,100 | $271,000 | $312,100 |
| 2023 | $6,857 | $508,300 | $246,300 | $262,000 |
| 2022 | $6,347 | $416,200 | $246,300 | $169,900 |
| 2021 | $257 | $376,600 | $212,800 | $163,800 |
| 2020 | $249 | $369,200 | $212,800 | $156,400 |
| 2019 | $5,888 | $358,800 | $212,800 | $146,000 |
| 2018 | $5,602 | $344,100 | $212,800 | $131,300 |
| 2017 | $5,572 | $337,300 | $212,800 | $124,500 |
| 2016 | $5,311 | $315,000 | $193,400 | $121,600 |
| 2015 | $5,087 | $315,000 | $193,400 | $121,600 |
Source: Public Records
Map
Nearby Homes