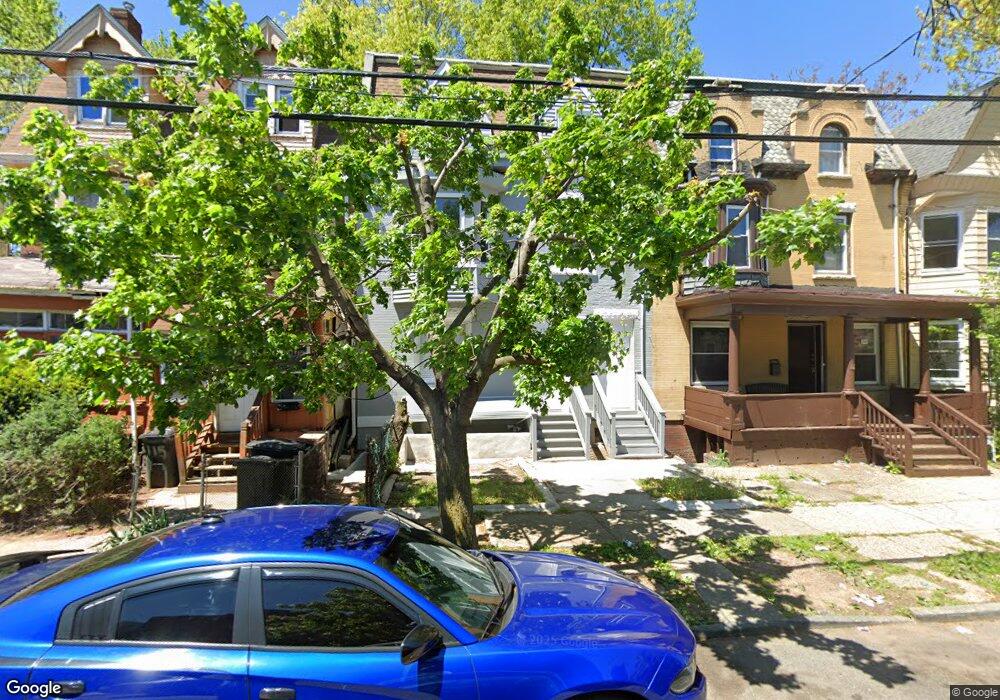
113 S 11th St Unit 3 Newark, NJ 07107
Fairmount NeighborhoodEstimated Value: $517,000 - $641,000
--
Bed
19
Baths
3,062
Sq Ft
$185/Sq Ft
Est. Value
About This Home
This home is located at 113 S 11th St Unit 3, Newark, NJ 07107 and is currently estimated at $565,206, approximately $184 per square foot. 113 S 11th St Unit 3 is a home located in Essex County with nearby schools including Sir Isaac Newton Elementary School, Harriet Tubman School, and Camden Street Elementary School.
Ownership History
Date
Name
Owned For
Owner Type
Purchase Details
Closed on
Jan 25, 2022
Sold by
Uprise Homes Llc
Bought by
Robinson Elijah A and Samuel-Robinson Linda
Current Estimated Value
Home Financials for this Owner
Home Financials are based on the most recent Mortgage that was taken out on this home.
Original Mortgage
$352,500
Interest Rate
3.55%
Mortgage Type
New Conventional
Purchase Details
Closed on
Feb 19, 2021
Sold by
City Of Newark
Bought by
Uprise Homes Llc
Home Financials for this Owner
Home Financials are based on the most recent Mortgage that was taken out on this home.
Original Mortgage
$244,590
Interest Rate
2.7%
Mortgage Type
Construction
Purchase Details
Closed on
Dec 17, 2009
Sold by
American General Financial Services Inc
Bought by
Wow Properties Llc
Purchase Details
Closed on
May 27, 2008
Sold by
Campbell Dannie E and Campbell Dannie E
Bought by
American General Financial Services Inc
Purchase Details
Closed on
Apr 9, 2003
Sold by
Plater Ala
Bought by
Campbell Dannie
Create a Home Valuation Report for This Property
The Home Valuation Report is an in-depth analysis detailing your home's value as well as a comparison with similar homes in the area
Home Values in the Area
Average Home Value in this Area
Purchase History
| Date | Buyer | Sale Price | Title Company |
|---|---|---|---|
| Robinson Elijah A | $470,000 | New Title Company Name | |
| Uprise Homes Llc | $141,100 | National Integrity Llc | |
| Wow Properties Llc | $27,600 | First American Title Ins Co | |
| American General Financial Services Inc | -- | Independence Abstract & Titl | |
| Campbell Dannie | $85,000 | -- |
Source: Public Records
Mortgage History
| Date | Status | Borrower | Loan Amount |
|---|---|---|---|
| Previous Owner | Robinson Elijah A | $352,500 | |
| Previous Owner | Uprise Homes Llc | $244,590 |
Source: Public Records
Tax History Compared to Growth
Tax History
| Year | Tax Paid | Tax Assessment Tax Assessment Total Assessment is a certain percentage of the fair market value that is determined by local assessors to be the total taxable value of land and additions on the property. | Land | Improvement |
|---|---|---|---|---|
| 2025 | $8,794 | $235,900 | $21,300 | $214,600 |
| 2024 | $8,794 | $235,900 | $21,300 | $214,600 |
| 2022 | $3,624 | $97,000 | $21,300 | $75,700 |
| 2021 | $3,622 | $97,000 | $21,300 | $75,700 |
| 2020 | $0 | $97,000 | $21,300 | $75,700 |
| 2019 | $0 | $97,000 | $21,300 | $75,700 |
| 2018 | $0 | $97,000 | $21,300 | $75,700 |
| 2017 | $0 | $97,000 | $21,300 | $75,700 |
| 2016 | $0 | $97,000 | $21,300 | $75,700 |
| 2015 | $3,210 | $97,000 | $21,300 | $75,700 |
| 2014 | $3,008 | $97,000 | $21,300 | $75,700 |
Source: Public Records
Map
Nearby Homes
- 113 S 11th St
- 113 S 11th St Unit 1
- 113 S 11th St Unit 2
- 111 S 11th St
- 115 S 11th St Unit 117
- 109 S 11th St
- 109 S 11th St Unit 3
- 119 S 11th St
- 105 S 11th St
- 121 S 11th St
- 106 S 12th St
- 110 S 12th St
- 112 S 12th St
- 103 S 11th St
- 114 S 12th St
- 104 S 12th St Unit 3
- 104 S 12th St Unit 1
- 104 S 12th St
- 100 S 12th St
- 100 S 12th St Unit 2