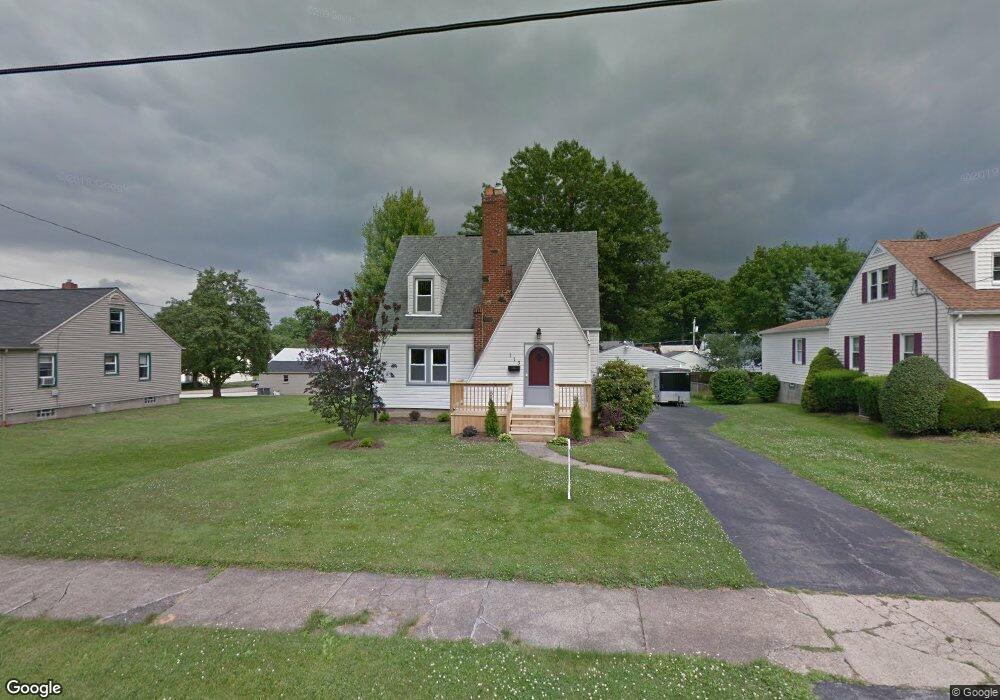
113 S Edgehill Ave Youngstown, OH 44515
Austintown NeighborhoodEstimated Value: $147,000 - $173,000
4
Beds
1
Bath
1,394
Sq Ft
$112/Sq Ft
Est. Value
About This Home
This home is located at 113 S Edgehill Ave, Youngstown, OH 44515 and is currently estimated at $156,454, approximately $112 per square foot. 113 S Edgehill Ave is a home located in Mahoning County with nearby schools including Austintown Elementary School, Austintown Intermediate School, and Austintown Middle School.
Ownership History
Date
Name
Owned For
Owner Type
Purchase Details
Closed on
Aug 22, 2011
Sold by
L & T Affordable Properties Llc
Bought by
Brady James
Current Estimated Value
Home Financials for this Owner
Home Financials are based on the most recent Mortgage that was taken out on this home.
Original Mortgage
$68,225
Outstanding Balance
$49,230
Interest Rate
5.5%
Mortgage Type
FHA
Estimated Equity
$107,224
Purchase Details
Closed on
Feb 16, 2011
Sold by
Fannie Mae
Bought by
L & R Affordable Properties Llc
Purchase Details
Closed on
Jun 14, 2010
Sold by
Wareham Dennis B
Bought by
Federal National Mortgage Association
Purchase Details
Closed on
Mar 25, 2004
Sold by
Kotouch Roger W and Kotouch Roger Wayne
Bought by
Wareham Dennis B
Home Financials for this Owner
Home Financials are based on the most recent Mortgage that was taken out on this home.
Original Mortgage
$69,520
Interest Rate
5.65%
Mortgage Type
Stand Alone Second
Purchase Details
Closed on
Dec 22, 1982
Bought by
Kotouch Jean L
Create a Home Valuation Report for This Property
The Home Valuation Report is an in-depth analysis detailing your home's value as well as a comparison with similar homes in the area
Home Values in the Area
Average Home Value in this Area
Purchase History
| Date | Buyer | Sale Price | Title Company |
|---|---|---|---|
| Brady James | $70,000 | Barristers Of Ohio Llc | |
| L & R Affordable Properties Llc | $28,700 | Accutitle Agency Inc | |
| Federal National Mortgage Association | $52,000 | None Available | |
| Wareham Dennis B | $86,900 | American Land Title Agency I | |
| Kotouch Jean L | -- | -- |
Source: Public Records
Mortgage History
| Date | Status | Borrower | Loan Amount |
|---|---|---|---|
| Open | Brady James | $68,225 | |
| Previous Owner | Wareham Dennis B | $69,520 |
Source: Public Records
Tax History Compared to Growth
Tax History
| Year | Tax Paid | Tax Assessment Tax Assessment Total Assessment is a certain percentage of the fair market value that is determined by local assessors to be the total taxable value of land and additions on the property. | Land | Improvement |
|---|---|---|---|---|
| 2024 | $1,996 | $43,090 | $2,980 | $40,110 |
| 2023 | $1,961 | $43,090 | $2,980 | $40,110 |
| 2022 | $1,265 | $22,190 | $2,860 | $19,330 |
| 2021 | $1,266 | $22,190 | $2,860 | $19,330 |
| 2020 | $1,271 | $22,190 | $2,860 | $19,330 |
| 2019 | $1,219 | $19,130 | $2,470 | $16,660 |
| 2018 | $1,175 | $19,130 | $2,470 | $16,660 |
| 2017 | $1,158 | $19,130 | $2,470 | $16,660 |
| 2016 | $1,207 | $19,740 | $2,850 | $16,890 |
| 2015 | $1,167 | $19,740 | $2,850 | $16,890 |
| 2014 | $1,172 | $19,740 | $2,850 | $16,890 |
| 2013 | $1,160 | $19,740 | $2,850 | $16,890 |
Source: Public Records
Map
Nearby Homes
- 81 S Edgehill Ave
- 102 Parkgate Ave
- 122 S Edgehill Ave
- 136 Rosemont Ave
- 4258 Mahoning Ave
- 210 S Beverly Ave
- 263 S Main St
- 252 Rosemont Ave
- 258 S Navarre Ave
- 107 N Roanoke Ave
- 98 N Navarre Ave
- 97 Idlewood Rd
- 0 Elmwood Ave
- 3828 Oakleigh Ave
- 169 Westminster Ave
- 0 S Raccoon Rd Unit 5142489
- 161 N Roanoke Ave
- 97 S Four Mile Run Rd
- 603 S Raccoon Rd Unit 14
- 603 S Raccoon Rd Unit 9
- 103 S Edgehill Ave
- 121 S Edgehill Ave
- 108 Parkgate Ave
- 114 Parkgate Ave
- 120 Parkgate Ave
- 110 S Edgehill Ave
- 124 Parkgate Ave
- 106 S Edgehill Ave
- 116 S Edgehill Ave
- 102 S Edgehill Ave
- 135 S Edgehill Ave
- 96 Parkgate Ave
- 126 S Edgehill Ave
- 77 S Edgehill Ave
- 84 S Edgehill Ave
- 139 S Edgehill Ave
- 130 S Edgehill Ave
- 138 Parkgate Ave
- 138 S Edgehill Ave
- 88 Parkgate Ave