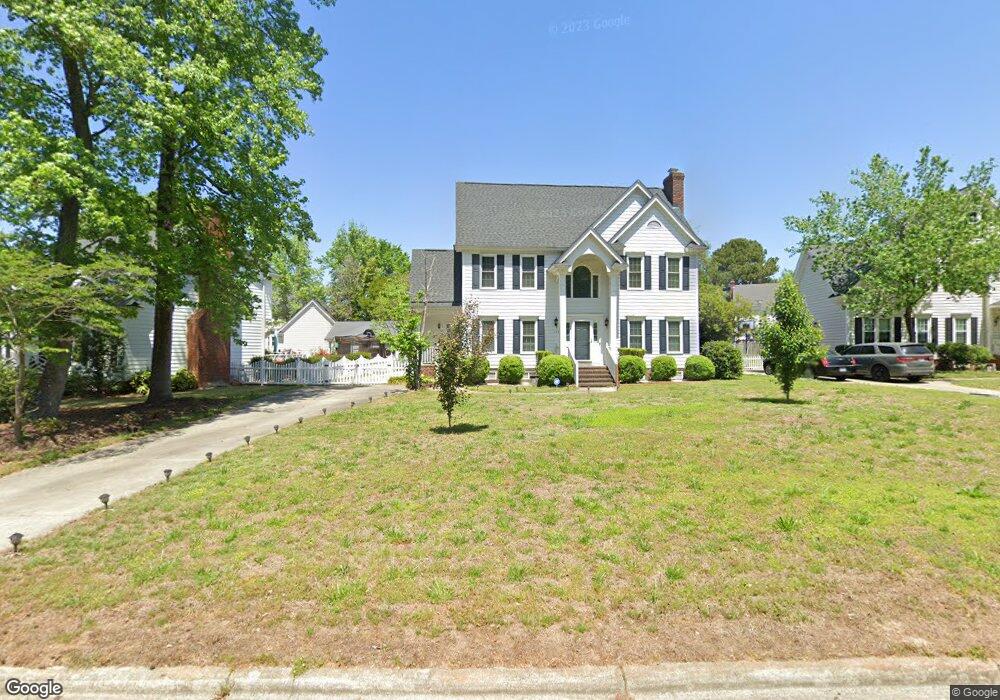
113 Sion Ct Rocky Mount, NC 27803
Estimated Value: $264,000 - $279,000
3
Beds
3
Baths
1,910
Sq Ft
$140/Sq Ft
Est. Value
About This Home
This home is located at 113 Sion Ct, Rocky Mount, NC 27803 and is currently estimated at $268,085, approximately $140 per square foot. 113 Sion Ct is a home located in Nash County with nearby schools including Williford Elementary School, Winstead Avenue Elementary School, and G.R. Edwards Middle School.
Ownership History
Date
Name
Owned For
Owner Type
Purchase Details
Closed on
Feb 19, 2013
Sold by
The Secretary Of Veterans Affairs
Bought by
Harvey Gaelan M and Harvey Marquis C
Current Estimated Value
Home Financials for this Owner
Home Financials are based on the most recent Mortgage that was taken out on this home.
Original Mortgage
$108,450
Interest Rate
3.52%
Mortgage Type
New Conventional
Purchase Details
Closed on
Apr 24, 2012
Sold by
Searcy Lorenza R and Searcy Gardenia L
Bought by
The Secretary Of Veterans Affairs
Purchase Details
Closed on
Mar 30, 2005
Sold by
Bingley Bradley D and Bingley Deanna M
Bought by
Creen Wondus L and Green Tamara L
Home Financials for this Owner
Home Financials are based on the most recent Mortgage that was taken out on this home.
Original Mortgage
$33,980
Interest Rate
5.99%
Mortgage Type
Stand Alone Second
Create a Home Valuation Report for This Property
The Home Valuation Report is an in-depth analysis detailing your home's value as well as a comparison with similar homes in the area
Home Values in the Area
Average Home Value in this Area
Purchase History
| Date | Buyer | Sale Price | Title Company |
|---|---|---|---|
| Harvey Gaelan M | -- | None Available | |
| The Secretary Of Veterans Affairs | $114,569 | None Available | |
| Creen Wondus L | $170,000 | None Available |
Source: Public Records
Mortgage History
| Date | Status | Borrower | Loan Amount |
|---|---|---|---|
| Previous Owner | Harvey Gaelan M | $108,450 | |
| Previous Owner | Creen Wondus L | $33,980 | |
| Previous Owner | Creen Wondus L | $135,920 |
Source: Public Records
Tax History Compared to Growth
Tax History
| Year | Tax Paid | Tax Assessment Tax Assessment Total Assessment is a certain percentage of the fair market value that is determined by local assessors to be the total taxable value of land and additions on the property. | Land | Improvement |
|---|---|---|---|---|
| 2024 | $1,508 | $175,580 | $24,510 | $151,070 |
| 2023 | $1,176 | $175,580 | $0 | $0 |
| 2022 | $1,203 | $175,580 | $24,510 | $151,070 |
| 2021 | $1,176 | $175,580 | $24,510 | $151,070 |
| 2020 | $1,176 | $175,580 | $24,510 | $151,070 |
| 2019 | $1,176 | $175,580 | $24,510 | $151,070 |
| 2018 | $1,176 | $175,580 | $0 | $0 |
| 2017 | $1,176 | $175,580 | $0 | $0 |
| 2015 | $1,177 | $175,736 | $0 | $0 |
| 2014 | $1,177 | $175,736 | $0 | $0 |
Source: Public Records
Map
Nearby Homes
- 3924 Hampton Dr
- 3812 Gloucester Rd
- 108 Chelsea Ct
- 3545 Chelsea Dr
- 3905 Crosswinds Dr
- 105 Litchfield Ct
- 3904 Crosswinds Dr
- 5025 Netherwood Rd
- 70 S King Richard Ct Unit 70
- 4037 Brassfield Dr
- 113 Edinborough Ct
- 4001 Lochinvar Ln
- 3013 Brassfield Dr
- 132 Rockfall Way
- 322 Gravely Dr
- 616 Chad St
- 3821 Mansfield Dr
- 117 Tam o Shanter Dr
- 3801 Hawthorne Rd
- 3811 Woodlawn Rd