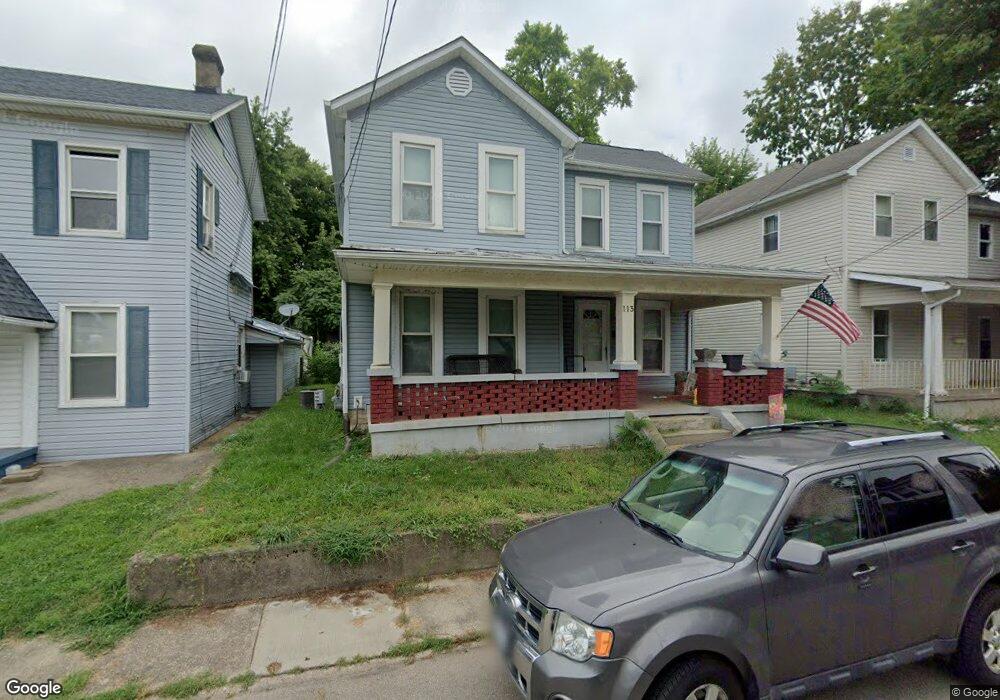
113 W 7th St Franklin, OH 45005
Estimated Value: $155,000 - $163,854
3
Beds
3
Baths
1,502
Sq Ft
$106/Sq Ft
Est. Value
About This Home
This home is located at 113 W 7th St, Franklin, OH 45005 and is currently estimated at $158,714, approximately $105 per square foot. 113 W 7th St is a home located in Warren County with nearby schools including Franklin High School.
Ownership History
Date
Name
Owned For
Owner Type
Purchase Details
Closed on
Jun 10, 2004
Sold by
Northern Thomas A
Bought by
Thomas Linda M and Thomas Linda
Current Estimated Value
Home Financials for this Owner
Home Financials are based on the most recent Mortgage that was taken out on this home.
Original Mortgage
$68,820
Outstanding Balance
$32,786
Interest Rate
6.17%
Mortgage Type
FHA
Estimated Equity
$125,928
Purchase Details
Closed on
Aug 18, 1994
Sold by
Est Ruth I West
Bought by
Smith Finley E and Smith Loretta E
Home Financials for this Owner
Home Financials are based on the most recent Mortgage that was taken out on this home.
Original Mortgage
$51,350
Interest Rate
8.73%
Mortgage Type
FHA
Purchase Details
Closed on
Jun 15, 1981
Sold by
Venis Smith and Venis Ray
Purchase Details
Closed on
Mar 1, 1978
Sold by
Smith Smith and Smith Willie
Create a Home Valuation Report for This Property
The Home Valuation Report is an in-depth analysis detailing your home's value as well as a comparison with similar homes in the area
Home Values in the Area
Average Home Value in this Area
Purchase History
| Date | Buyer | Sale Price | Title Company |
|---|---|---|---|
| Thomas Linda M | $69,900 | Buckeye Title Agency Inc | |
| Smith Finley E | $51,500 | -- | |
| -- | -- | -- | |
| -- | $20,000 | -- |
Source: Public Records
Mortgage History
| Date | Status | Borrower | Loan Amount |
|---|---|---|---|
| Open | Thomas Linda M | $68,820 | |
| Previous Owner | Smith Finley E | $51,350 |
Source: Public Records
Tax History
| Year | Tax Paid | Tax Assessment Tax Assessment Total Assessment is a certain percentage of the fair market value that is determined by local assessors to be the total taxable value of land and additions on the property. | Land | Improvement |
|---|---|---|---|---|
| 2025 | $1,536 | $31,040 | $5,870 | $25,170 |
| 2024 | $1,536 | $31,040 | $5,870 | $25,170 |
| 2023 | $1,304 | $23,912 | $3,325 | $20,587 |
| 2022 | $1,279 | $23,912 | $3,325 | $20,587 |
| 2021 | $1,213 | $23,912 | $3,325 | $20,587 |
| 2020 | $1,094 | $18,977 | $2,639 | $16,338 |
| 2019 | $999 | $18,977 | $2,639 | $16,338 |
| 2018 | $964 | $18,977 | $2,639 | $16,338 |
| 2017 | $1,031 | $17,917 | $2,538 | $15,379 |
| 2016 | $1,051 | $17,917 | $2,538 | $15,379 |
| 2015 | $1,051 | $17,917 | $2,538 | $15,379 |
| 2014 | $1,043 | $17,920 | $2,540 | $15,380 |
| 2013 | $900 | $20,720 | $2,930 | $17,790 |
Source: Public Records
Map
Nearby Homes
Your Personal Tour Guide
Ask me questions while you tour the home.