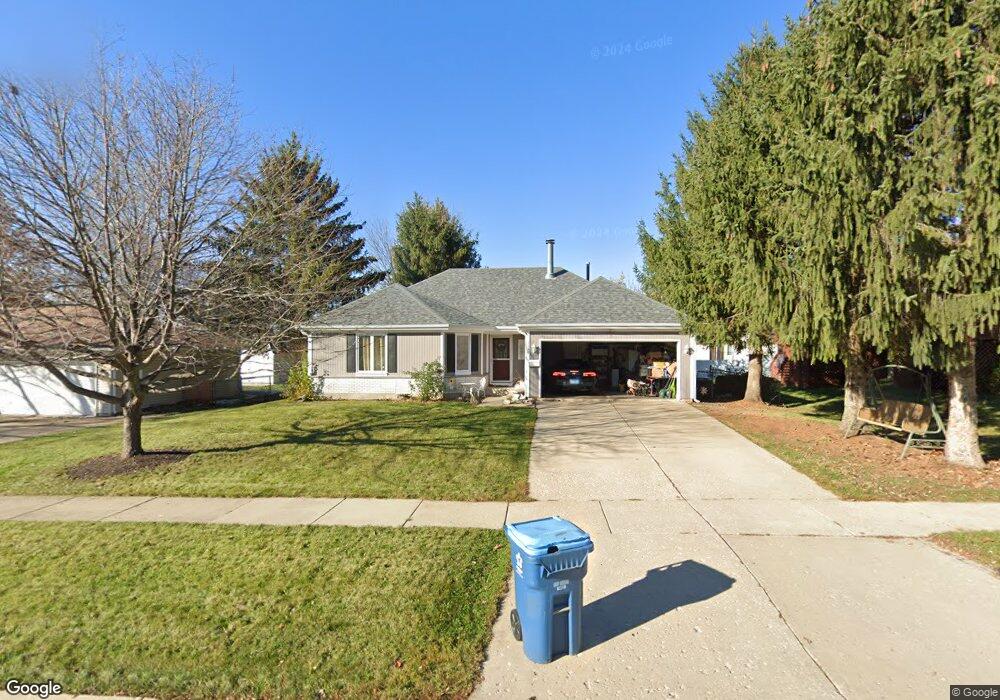
1130 Cochran St Aurora, IL 60506
Edgelawn Randall NeighborhoodEstimated Value: $323,000 - $333,000
3
Beds
2
Baths
1,267
Sq Ft
$259/Sq Ft
Est. Value
About This Home
This home is located at 1130 Cochran St, Aurora, IL 60506 and is currently estimated at $328,663, approximately $259 per square foot. 1130 Cochran St is a home located in Kane County with nearby schools including Hall Elementary School, Jefferson Middle School, and West Aurora High School.
Ownership History
Date
Name
Owned For
Owner Type
Purchase Details
Closed on
May 5, 2003
Sold by
Lombardi Patricia
Bought by
Kamaris George D
Current Estimated Value
Home Financials for this Owner
Home Financials are based on the most recent Mortgage that was taken out on this home.
Original Mortgage
$124,200
Outstanding Balance
$54,608
Interest Rate
5.95%
Mortgage Type
Purchase Money Mortgage
Estimated Equity
$274,055
Purchase Details
Closed on
Aug 27, 2001
Sold by
Lombardi Josephine and Lombardi Richard J
Bought by
Lombardi Patricia
Home Financials for this Owner
Home Financials are based on the most recent Mortgage that was taken out on this home.
Original Mortgage
$110,000
Interest Rate
8.24%
Purchase Details
Closed on
Oct 11, 2000
Sold by
Chicago Title Land Trust Company
Bought by
Lombardi Josephine and Lombardi Richard
Create a Home Valuation Report for This Property
The Home Valuation Report is an in-depth analysis detailing your home's value as well as a comparison with similar homes in the area
Home Values in the Area
Average Home Value in this Area
Purchase History
| Date | Buyer | Sale Price | Title Company |
|---|---|---|---|
| Kamaris George D | $138,000 | First American Title | |
| Lombardi Patricia | -- | Chicago Title Insurance Co | |
| Lombardi Josephine | -- | -- |
Source: Public Records
Mortgage History
| Date | Status | Borrower | Loan Amount |
|---|---|---|---|
| Open | Kamaris George D | $124,200 | |
| Previous Owner | Lombardi Patricia | $110,000 |
Source: Public Records
Tax History
| Year | Tax Paid | Tax Assessment Tax Assessment Total Assessment is a certain percentage of the fair market value that is determined by local assessors to be the total taxable value of land and additions on the property. | Land | Improvement |
|---|---|---|---|---|
| 2024 | $6,454 | $89,512 | $15,912 | $73,600 |
| 2023 | $6,165 | $79,978 | $14,217 | $65,761 |
| 2022 | $5,928 | $72,973 | $12,972 | $60,001 |
| 2021 | $5,621 | $67,522 | $12,077 | $55,445 |
| 2020 | $5,310 | $62,718 | $11,218 | $51,500 |
| 2019 | $5,351 | $60,721 | $10,394 | $50,327 |
| 2018 | $4,900 | $55,085 | $9,614 | $45,471 |
| 2017 | $5,324 | $57,735 | $8,858 | $48,877 |
| 2016 | $4,626 | $49,548 | $7,593 | $41,955 |
| 2015 | -- | $41,986 | $6,529 | $35,457 |
| 2014 | -- | $37,945 | $6,279 | $31,666 |
| 2013 | -- | $39,486 | $6,190 | $33,296 |
Source: Public Records
Map
Nearby Homes
- 980 Sapphire Ln
- 968 Sapphire Ln
- 960 Sapphire Ln
- 972 Sapphire Ln
- 988 Sapphire Ln
- 976 Sapphire Ln
- 984 Sapphire Ln
- 991 Sapphire Ln
- 959 Sapphire Ln
- 975 Sapphire Ln
- 963 Sapphire Ln
- 987 Sapphire Ln
- 1930 Richard St Unit 1
- 1295 Foxcroft Dr
- 1071 Almond Dr
- 1086 Cascade Dr Unit 1
- 1322 Croton Ct Unit A
- 1475 Elder Dr
- 2140 Sandburg Dr
- 1615 Heather Dr
- 1120 Cochran St
- 1141 Grenada Dr
- 1131 Grenada Dr
- 1151 Grenada Dr Unit 9
- 1110 Cochran St
- 1131 Cochran St
- 1121 Grenada Dr
- 1141 Cochran St
- 1121 Cochran St
- 1100 Cochran St Unit 9
- 1111 Cochran St
- 1111 Grenada Dr
- 1971 Sapphire Ln
- 1981 Sapphire Ln Unit 9
- 1961 Sapphire Ln
- 1991 Sapphire Ln
- 1951 Sapphire Ln
- 1101 Cochran St
- 1130 Emerald Dr Unit 9
- 1140 Grenada Dr Unit 9
Your Personal Tour Guide
Ask me questions while you tour the home.