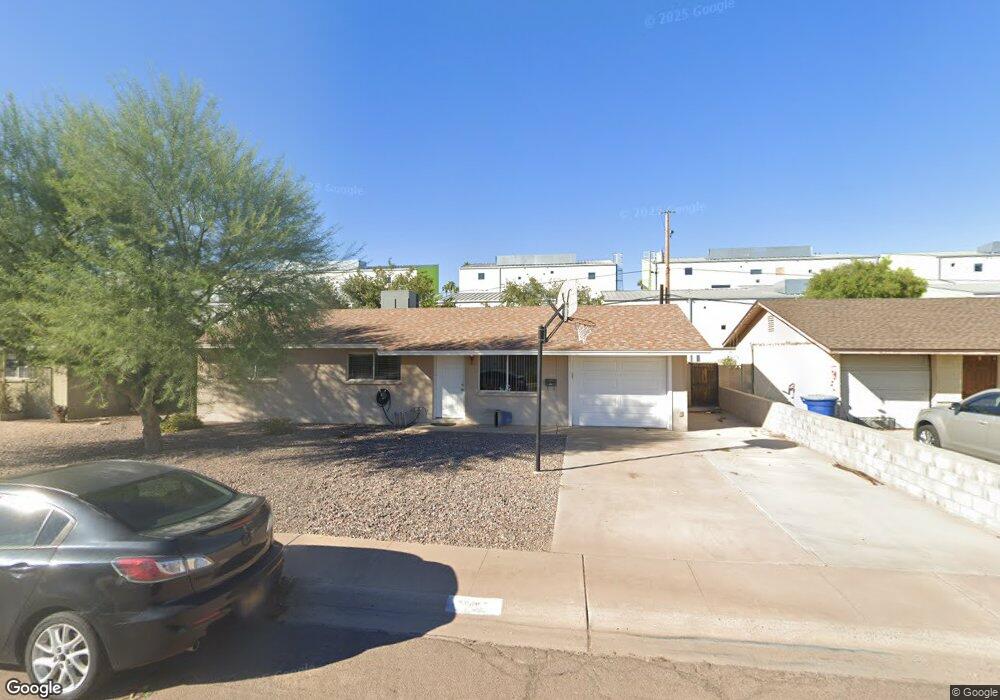
1130 W 9th St Unit 18 Tempe, AZ 85281
Gililland NeighborhoodEstimated Value: $384,972 - $519,000
3
Beds
2
Baths
1,350
Sq Ft
$347/Sq Ft
Est. Value
About This Home
This home is located at 1130 W 9th St Unit 18, Tempe, AZ 85281 and is currently estimated at $468,993, approximately $347 per square foot. 1130 W 9th St Unit 18 is a home located in Maricopa County with nearby schools including Geneva Epps Mosley Middle School, Tempe High School, and New School for the Arts & Academics.
Ownership History
Date
Name
Owned For
Owner Type
Purchase Details
Closed on
Sep 9, 2025
Sold by
Jackson Marvin R and Jackson Pamela L
Bought by
1130 W 9Th St Llc
Current Estimated Value
Purchase Details
Closed on
Jun 14, 2011
Sold by
Us Bank National Association
Bought by
Jackson Marvin Riddell and Jackson Pamela Lynn
Purchase Details
Closed on
Feb 18, 2011
Sold by
Lapeter James M
Bought by
Us Bank National Association
Purchase Details
Closed on
Dec 30, 2004
Sold by
Dana Stuart
Bought by
Lapeter James L
Home Financials for this Owner
Home Financials are based on the most recent Mortgage that was taken out on this home.
Original Mortgage
$126,000
Interest Rate
5.7%
Mortgage Type
New Conventional
Purchase Details
Closed on
Jan 7, 1999
Sold by
Moreno Ernest and Moreno Norma
Bought by
Dana Stuart
Home Financials for this Owner
Home Financials are based on the most recent Mortgage that was taken out on this home.
Original Mortgage
$80,750
Interest Rate
6.63%
Mortgage Type
New Conventional
Create a Home Valuation Report for This Property
The Home Valuation Report is an in-depth analysis detailing your home's value as well as a comparison with similar homes in the area
Home Values in the Area
Average Home Value in this Area
Purchase History
| Date | Buyer | Sale Price | Title Company |
|---|---|---|---|
| 1130 W 9Th St Llc | -- | None Listed On Document | |
| Jackson Marvin Riddell | $80,000 | First American Title Ins Co | |
| Us Bank National Association | $110,500 | Accommodation | |
| Lapeter James L | $180,000 | Old Republic Title Agency | |
| Dana Stuart | $95,000 | Ati Title Agency |
Source: Public Records
Mortgage History
| Date | Status | Borrower | Loan Amount |
|---|---|---|---|
| Previous Owner | Lapeter James L | $126,000 | |
| Previous Owner | Dana Stuart | $80,750 |
Source: Public Records
Tax History Compared to Growth
Tax History
| Year | Tax Paid | Tax Assessment Tax Assessment Total Assessment is a certain percentage of the fair market value that is determined by local assessors to be the total taxable value of land and additions on the property. | Land | Improvement |
|---|---|---|---|---|
| 2025 | $2,075 | $17,309 | -- | -- |
| 2024 | $1,916 | $16,485 | -- | -- |
| 2023 | $1,916 | $36,510 | $7,300 | $29,210 |
| 2022 | $1,837 | $27,110 | $5,420 | $21,690 |
| 2021 | $1,850 | $25,360 | $5,070 | $20,290 |
| 2020 | $1,794 | $22,730 | $4,540 | $18,190 |
| 2019 | $1,760 | $19,670 | $3,930 | $15,740 |
| 2018 | $1,716 | $17,060 | $3,410 | $13,650 |
| 2017 | $1,665 | $15,530 | $3,100 | $12,430 |
| 2016 | $1,653 | $14,730 | $2,940 | $11,790 |
| 2015 | $1,588 | $13,900 | $2,780 | $11,120 |
Source: Public Records
Map
Nearby Homes
- 1111 W University Dr Unit 3012
- 754 S Beck Ave
- 1310 W Romo Jones St
- 702 S Beck Ave
- 708 S Beck Ave
- 1306 W 11th St
- 1323 W 10th Place
- 1329 W 10th Place
- 1061 W 5th St Unit 3
- 616 S Hardy Dr Unit 139
- 616 S Hardy Dr Unit 224
- 616 S Hardy Dr Unit 201
- 815 W Elna Rae St
- 1306 W 12th St
- 1412 W 7th Place
- 700 W University Dr Unit 122
- 700 W University Dr Unit 253
- 415 S Robert Rd
- 315 S Beck Ave
- 620 W Howe St
- 1136 W 9th St
- 1124 W 9th St
- 1142 W 9th St Unit 18
- 1118 W 9th St
- 1129 W 9th St
- 1135 W 9th St
- 1123 W 9th St
- 1141 W 9th St
- 1117 W 9th St
- 1148 W 9th St
- 1111 W Univerity -- Unit 2027
- 1111 W University Dr Unit 2008
- 1111 W University Dr Unit 104
- 1111 W University Dr Unit 118
- 1111 W University Dr Unit 3006
- 1111 W University Dr Unit 222
- 1111 W University Dr Unit 1016
- 1111 W University Dr Unit 1025
- 1111 W University Dr Unit 3017
- 1111 W University Dr Unit 2027